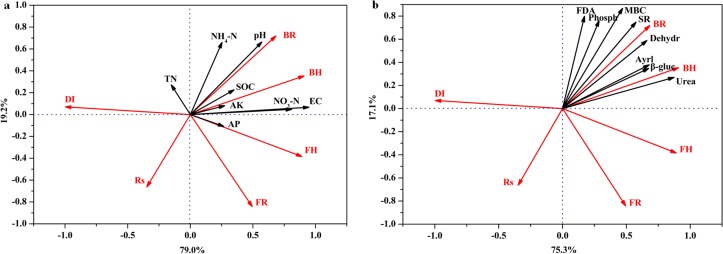
Fig 5. Association among level of bacterial wilt disease, microbial community diversity, soil physicochemical (a) and biological (b) properties.
Monte Carlo permutation tests carried out for all canonical axes confirmed the significance of the relationship between the two datasets (a: F = 4.07, P = 0.03; b: F = 8.67, P = 0.04). TN, total N; AP, available P; AK, available K; DI, tomato disease incidence; Rs, R. solanacearum population; BR, bacterial population richness; BH, microbial diversity of bacterial community; FR, fungal population richness; FH, microbial diversity of fungal community; Phosph, phosphomonoesterase activity; Aryl, arylsulfatase activity; β-gluco, β-D-glucosidase activity; Dehydro, dehydrogenase activity; Urea, urease activity; FDA, fluorescein diacetate hydrolase activity; MBC, microbial biomass carbon; SR, soil respiration.

