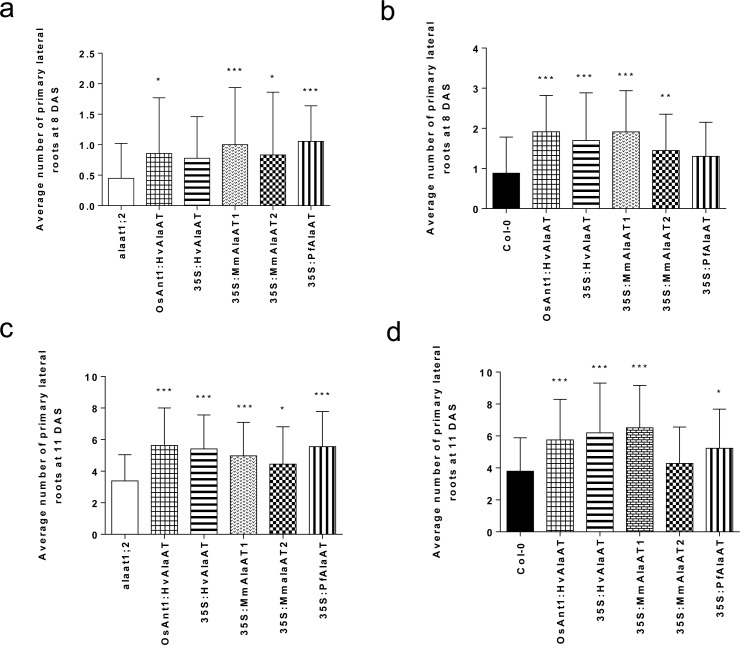
Fig 4. Average number of primary lateral roots between control and transgenic plants at 8 and 11 DAS.
The average number of primary lateral roots in each lighting block between controls and AlaAT transgenic lines was compared using two-way ANOVA (α = 0.05, P < 0.05). n = 6–9 for the number of replicates per genotype per block. a,c) alaat1;2 background; b,d) Col-0 background. * indicates significance in relation to control plants grown in the same lighting block. Error bars indicate SEM.

