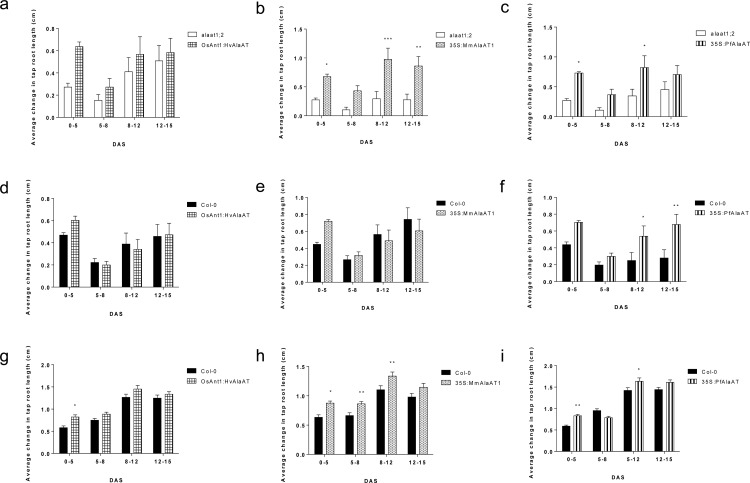
Fig 7. The average changes in vertical tap root length from 0–15 DAS of plants expressing various AlaATs in a Col-0 background when grown in limiting C and N combinations.
Over-expressing AlaAT plants (Col-0 background) were grown alongside controls in three combinations of C and N: a-c) ∼170 μE·m-2·sec-1 light, 0% sucrose and 1 mM NO3 -, d-f) ∼100 μE·m-2·sec-1, 0% sucrose and 1 mM NO3 -, g-i) ∼100 μE·m-2·sec-1, 0.2% sucrose and 0.25 mM NO3 -. Tap root lengths on plates were marked at 5, 8, 12 and 15 DAS. Changes in vertical root growth between 5–8, 8–12 and 12–15 DAS between controls and transgenics at these time points were compared using two-way ANOVA (α = 0.05, P < 0.05). At each time point for each line in each background n = 33–36. * indicates significance in relation to control plants grown during the same time frame on the same plates. Error bars indicate SEM.

