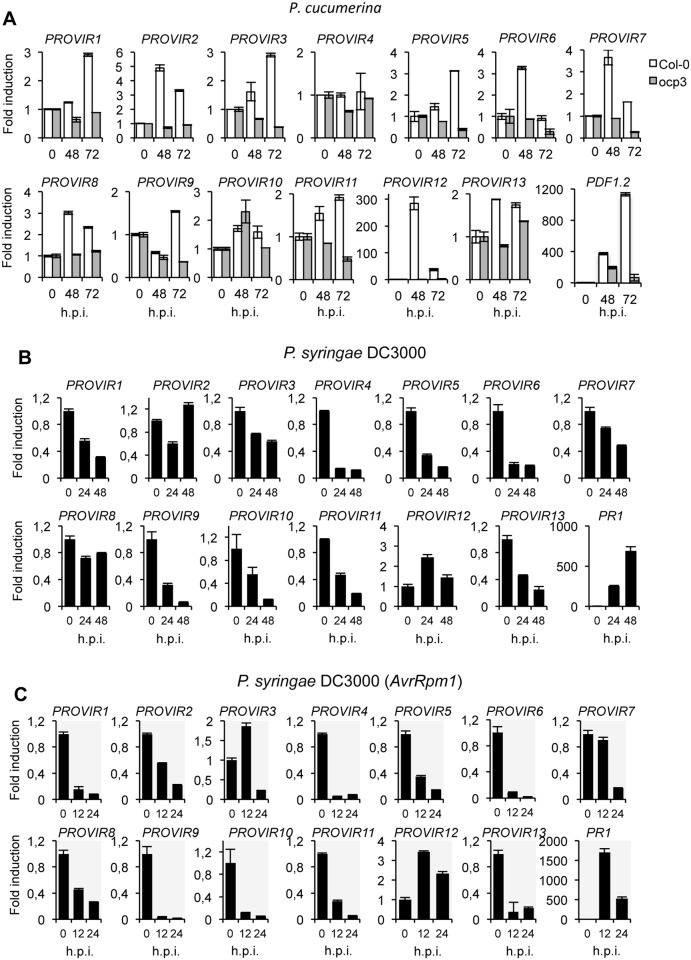
Fig 5. Expression patterns of PROVIR genes following pathogen inoculation.
(A) PROVIR1 to PROVIR13 expression in Col-0 and in the disease resistant mutant ocp3 in early P. cucumerina infection stages. Relative expression was assayed over a 72-h time course by quantitative RT-PCR on total RNA from leaves of Col-0 (white bars) and ocp3 (grey bars) following inoculation with a drop of spore suspension of P. cucumerina. Leaf sectors centered around the inoculation point were sampled for RNA extraction. Expression of the defense-related PDF1.2 gene was concurrently assayed as internal control for comparison. Data represent means ± SD (n = 3 biological replicates). Expression was normalized to the constitutive ACT2 gene, then to expression at each time point in mocked Col-0 and ocp3 plants. (B-C) RT-qPCR analyses showing repression of PROVIR gene expression upon infection with virulent P.s.DC3000 at 0, 24, and 48 post inoculation (h.p.i.) (B), and following infection with the avirulent P.s. DC3000 (AvrRpm1) strain at 0, 12, and 24 h.p.i. (C). Data represent mean ± SD, n = 3 replicates. Expression was normalized to the constitutive ACT2 gene, then to expression at each time point in mocked Col-0 plants.

