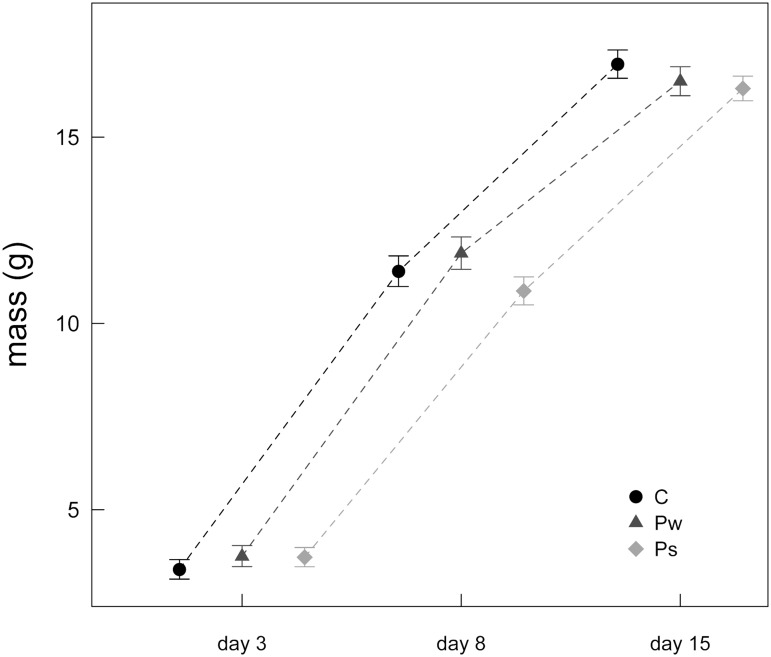
Fig 4. Nestling mass (mean±SE) on three measurement days.
The shape of growth curves differed significantly according to the interaction between the treatments (P<0.001). Growth was slower from day 3 to day 8 in the Ps group and from day 8 to day 15 in the Pw group. C = mothers exposed to control treatment; Ps = mothers exposed to the sparrowhawk predator treatment; Pw = mothers exposed to the weasel predator treatment.

