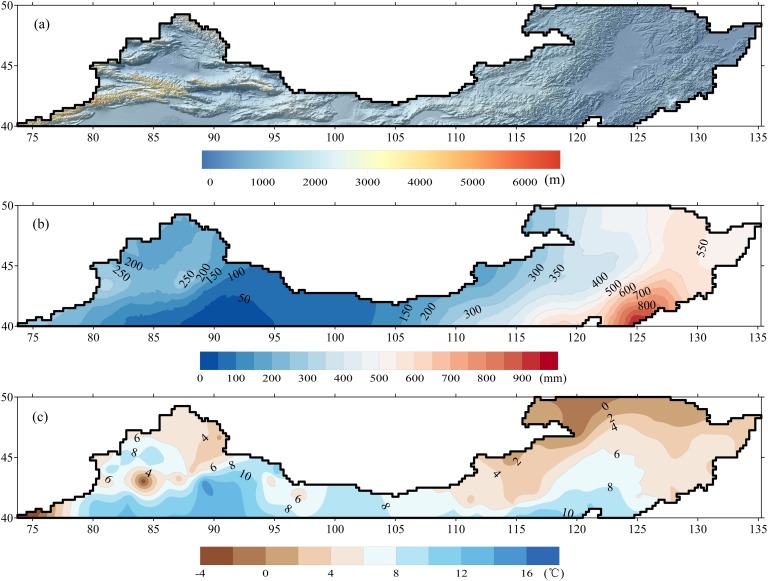
Fig 2. The spatial distribution of terrain and elevation, mean annual precipitation and mean air temperature during 1990–2012 across the study area: (a) terrain and elevation, (b) precipitation and (c) air temperature.
Shuttle Radar Topography Mission (SRTM) DEM with spatial resulution of 90 meters is resampled to 0.02° to represent terrain. Kriging method is used to interpolate observations from 169 weather stations during 1990–2012 to maps of precipitation and temperature.

