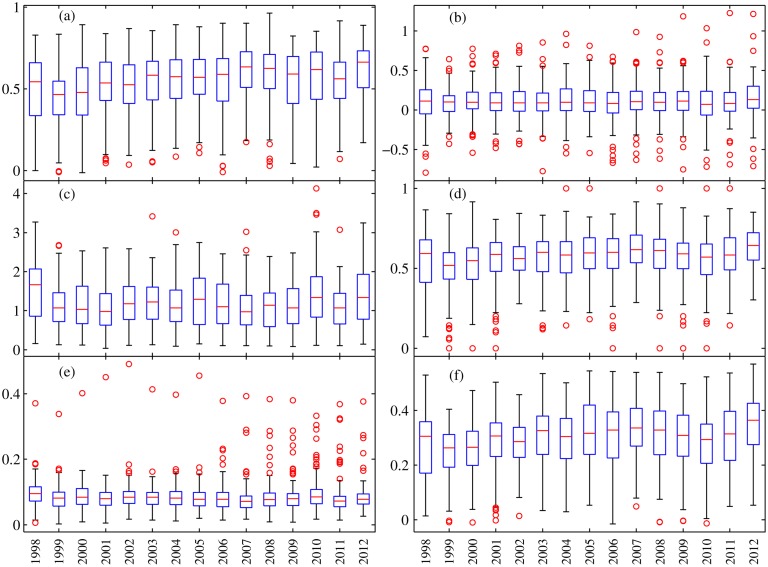
Fig 10. Boxplots of the six accuracy indices used in this study: (a) CC, (b) ME, (c) MAE, (d) POD, (e) POFD, (f) ETS.
Each box shows the 25th and 75th percentiles of distributions of each accuracy index. The horizontal line shows the median of the distributions, and the whiskers extend out to largest and smallest values within 1.5 times the interquartile range. And the circle represents outliers.

