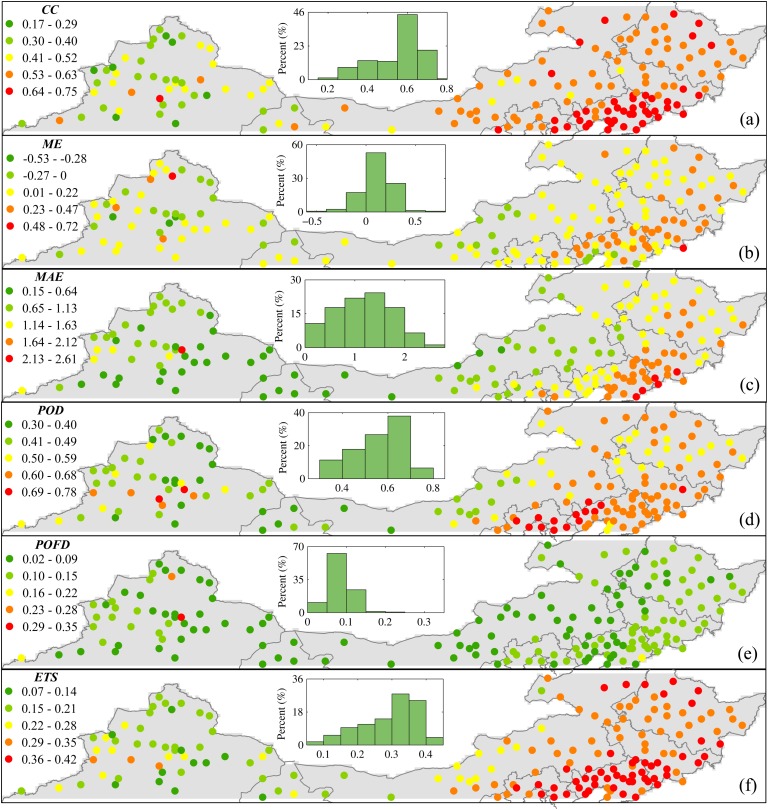
Fig 11. Spatial distribution of accuracy indices based on daily precipitation data during 1998–2012: (a) CC, (b) ME, (c) MAE, (d) POD, (e) POFD, (f) ETS.
Each point is the center of one TMPA grid box which includes at least one rain gauge. The shaded region indicates precipitation during summer and winter.

