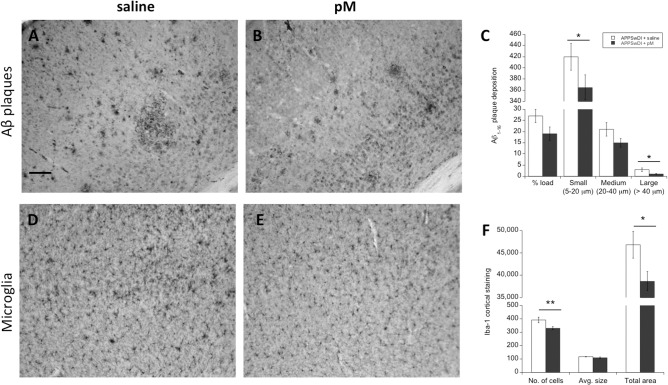
Fig 5. AD-like pathologies in monocyte-infused APPSwDI mice.
Following monocyte infusions, brains were collected and cortical regions were evaluated for Aβ deposition (A-C), and microglial Iba1+ cell staining (D-F). APPSwDI mice receiving young peripheral blood monocyte (pM) i.v. infusions (B,E) are indicated with a shaded gray bar (n = 8). APPSwDI mice receiving saline (A,D) served as negative controls and are indicated with a white bar (n = 7). Amyloid plaque deposition was assessed using an antibody against Aβ1–16 for percent plaque load and specific plaque sizes in the cortex (A-C). Microglial cell activation was evaluated using an antibody against ionized calcium-binding adapter molecule 1 (Iba1). Bar graphs display the mean ± SEM (error bars) of plaque/axon/cell quantification. Two to four cortical sections were quantified per brain per animal. Statistical analysis was performed using a Student’s t-test (* p < 0.05, ** p < 0.01). Scale bar = 120 μm.

