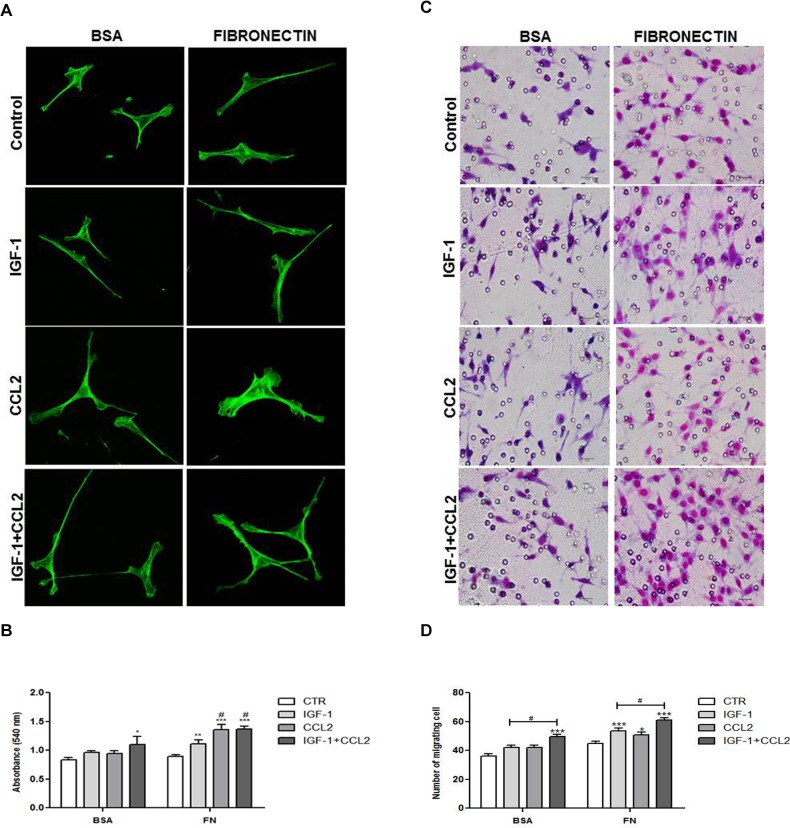
Fig 3. IGF-1 and/or CCL2 increased adhesion and migration of tEnd.1 cells.
(A) tEnd.1 cells treated with IGF-1 (100 ng/mL), CCL2 (10 ng/mL), or a combination of both for 24 h on BSA or FN coating were stained with Alexa 488-phalloidin and analyzed by confocal microscopy with a 63× objective. (B) tEnd.1 cells were allowed to adhere on BSA- or FN-coated surfaces for 1 h after stimulation with IGF-1, CCL2, or IGF-1/CCL2 for 24 h. (C) tEnd.1 cells were allowed to migrate through transwell chambers coated with BSA or FN after chemotactic stimulation with IGF-1, CCL2, or IGF-1/CCL2 for 6 h. Photomicrographs demonstrate cells invading through the transwell membrane. Giemsa staining. Scale bar = 10 μm. (D) Bars represent the number of migrating cells in a transwell system. Data are represented as mean ± SEM (n = 5/group). Results were analyzed by two-way ANOVA followed by Bonferroni’s post-test. Significant values compared to control group: p < 0.05 (*), p < 0.01 (**), or p < 0.0001 (***); significant values compared to control group and the IGF-1 treatment: p < 0.05 (#); and significant values compared to control group and single treatments: p < 0.01 (+).

