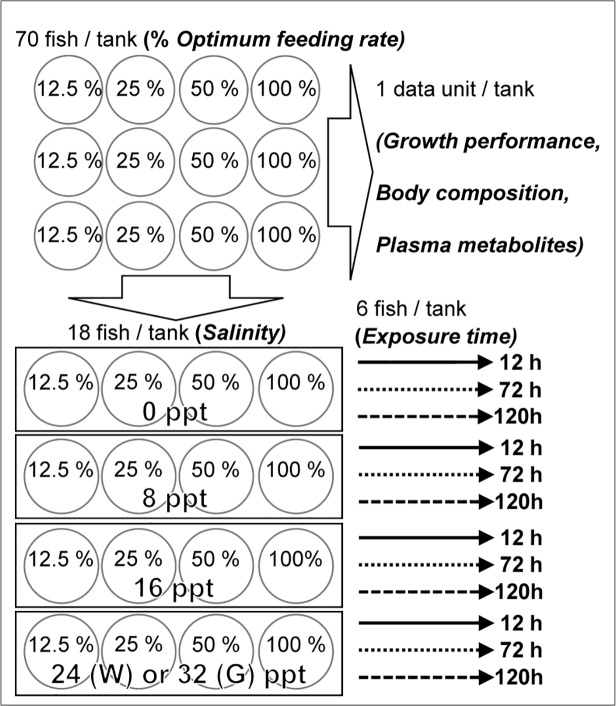
Fig 1. Experimental design.
First phase (top): Four levels of one treatment, feeding rate (12.5, 25, 50, 100%). Second phase (bottom): Four levels of the treatment salinity (0, 8, 16, 24/32 ppt), and three levels of the exposure time to salinity levels (12, 72, 120 h). The experimental design was the same for the two species, except that maximum salinity was different for white (W) and green (G) sturgeon.

