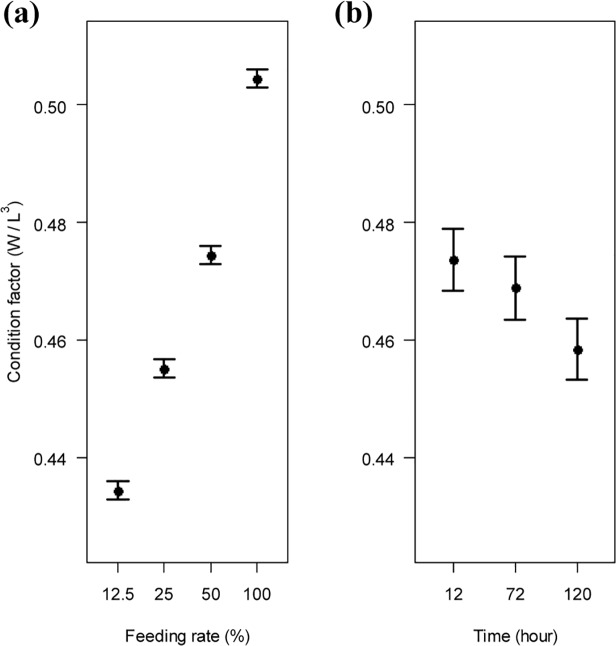
Fig 4. Generalized additive model fits and 95% confidence intervals from the optimal model for white sturgeon.
Relationships between growth performance, measured by condition factor, and each explanatory variable are illustrated. Sturgeons were challenged in a multiple-factor setting, first to levels of feeding rate (12.5, 25, 50, 100%), and then to salinity levels (0, 8, 16, 24 ppt) for a given time (12, 72, 120 h). Only feeding rate and time were kept in the final model. W = weight; L = length.

