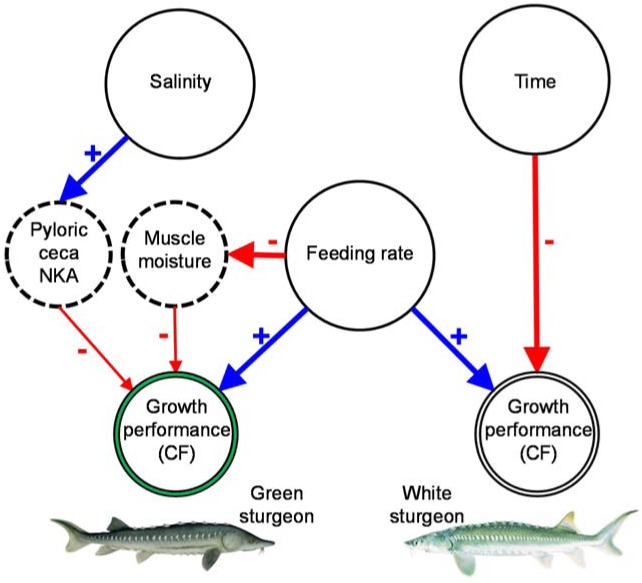
Fig 6. Schematic overview of the primary results.
The main relationships among the principal variables identified in this study are summarized as affecting directly or indirectly the growth performance of green and white juvenile sturgeon when challenged with levels of their feeding rate, salinity, and exposure time to salinity. Solid circles: treatments; dashed circles: osmoregulation parameters; double-line circles: growth performance measured by condition factor (CF). The sign associated with each arrow indicates whether the relationship is positive or negative for that effect. Wider arrows refer to the most significant relationships in this study.

