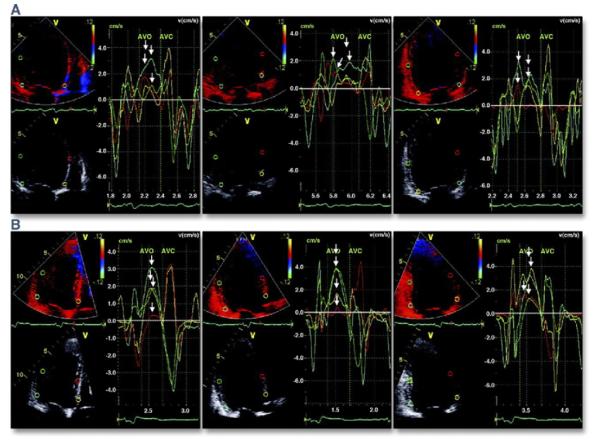
Figure 3. Color-Coded Tissue Velocity.

(A) Color-coded tissue velocity data from 12 left ventricular segments in a patient with dyssynchrony. (Left) Apical 4-chamber view, (middle) apical 3-chamber view, and (right) apical 2-chamber view. Arrows mark differences in time to peak velocity during systole for the various segments. (B) The same study after cardiac resynchronization therapy, with reduction in the disparity of time to peak activation. AVC = aortic valve closure; AVO = aortic valve opening. Reprinted, with permission, from Anderson LJ, Miyazaki C, Sutherland GR, Oh JK. Patient selection and echocardiographic assessment of dyssynchrony in cardiac resynchronization therapy. Circulation 2008;117:2009-23.
