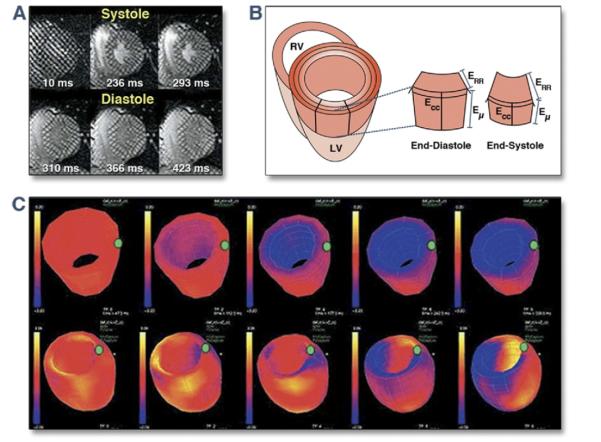
Figure 6. Myocardial Tagging by Cardiac Magnetic Resonance Imaging.

(A) Progressive deformation of the gird over the course of the cardiac cycle. This allows visual estimation of regions of myocardium that are contracting relatively late during systole. (B) Volumetric change of the myocardial segments over the course of the cardiac cycle. (C) Polar map illustrating the time course for contraction of the myocardial segments of the left ventricle (LV). RV = right ventricle. Reprinted, with permission, from Abraham T, Kass D, Tonti G, et al. Imaging cardiac resynchronization therapy. J Am Coll Cardiol Img 2009;2:486-97.
