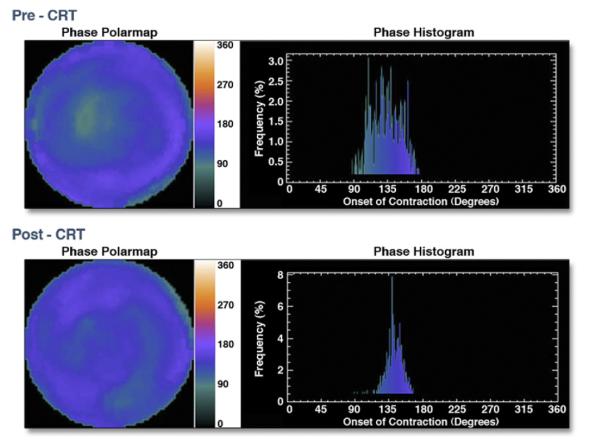
Figure 8. GMPS Phase Polar Map and Phase Histogram.

Gated myocardial perfusion single-photon emission computed tomography (GMPS) phase polar map before (top left) and after (bottom left) cardiac resynchronization therapy (CRT). The colored phase polar map demonstrates delayed contraction of the lateral wall compared with the septum before CRT, which corrects after CRT. The phase histogram before CRT (top right) demonstrates a wide bandwidth consistent with delayed contraction of the lateral wall compared with the septum. The phase histogram narrows after CRT (bottom right), consistent with more synchronized contraction. Reprinted, with permission, from Friehling M, Soman P. Newer applications of nuclear cardiology in systolic heart failure: detecting coronary artery disease and guiding device therapy. Curr Heart Fail Rep 2011;8:106-12.
