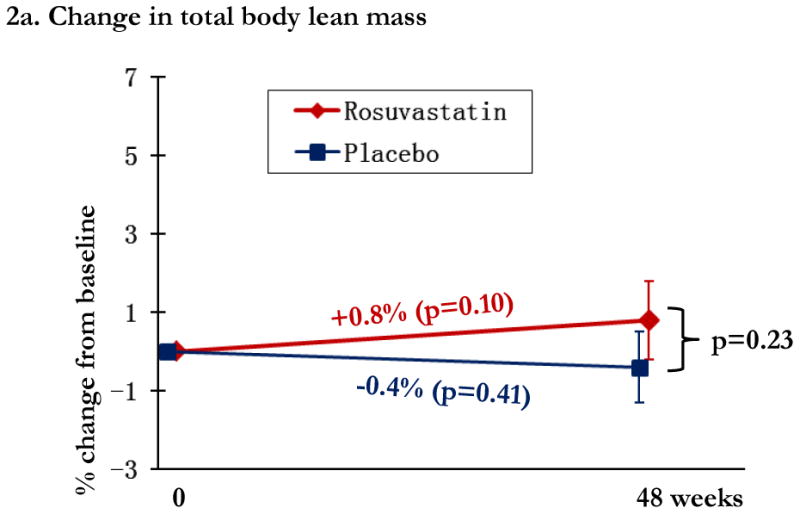
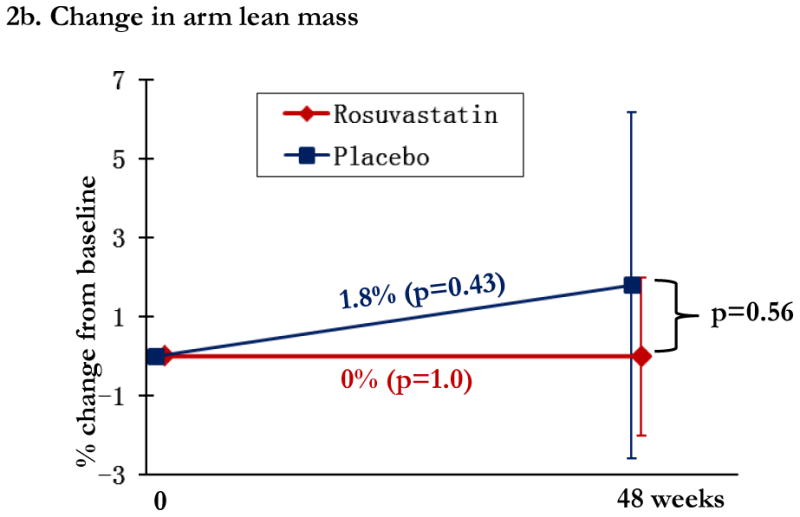
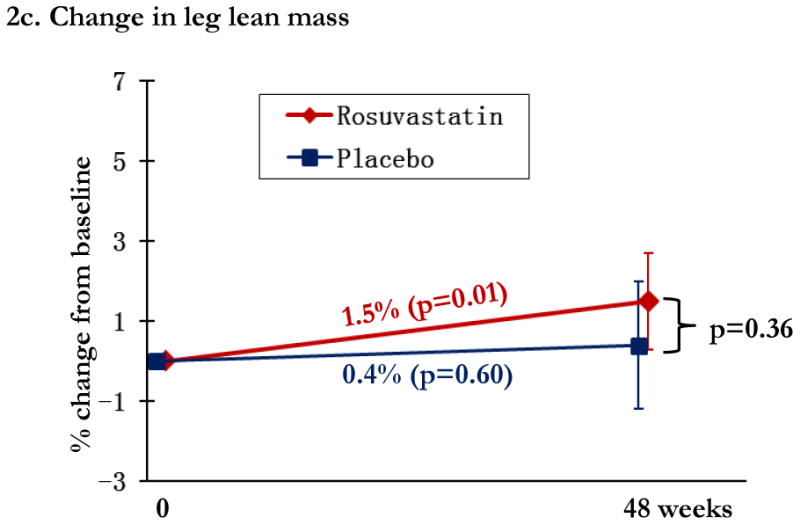
Figure 2.


Changes in lean mass by study arm. Changes in the rosuvastatin arm are shown in red and changes in the placebo arm are shown in blue. Within group relative changes and p values are indicated on the slope line in the respective color. P values for the comparison between study arms is provided in black font and indicated by the bracket.
