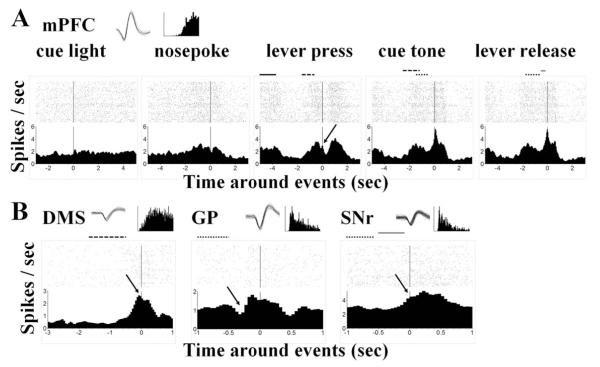
Fig. 3.
Rasters and perievent histograms showing neural activity around the behavioral events. (A) Change of activities of an mPFC neuron around cue light, nosepoke, lever press, cue tone, and lever release events. First panel: This neuron barely showed any response to the cue light. Second panel: It gradually fired more spikes for the preparation of the nosepoke with a dip around the event per se, followed by a gradual decrease of activity (see also the middle panel, with the solid bar indicating distribution of the nosepoke). Middle panel: It again picked up speed with the extension of the lever (dashed bar) towards the lever press, which happened on the down slope with a small but clear bounce back (indicated with the arrow). Forth panel: After the lever press (dotted bar), the firing rate increased rapidly and peaked slightly after the cue tone (50–100 ms after) with a peak of 5.63 Hz. Last panel: Although the peak is closer to the lever release event (−50 to 0 ms before), but the peak value is slight lower (5.56 Hz), so it can be viewed as a peak during the tone-release interval and aligned better to the cue tone event. (B) Examples of neuronal response from the other three recording areas. Left panel: A DMS neuron started to increase firing rate 0.5 s before lever press and peaked immediately before the event (indicated by the arrow). Middle panel: A GP neuron showed a dip (see arrow head) after the lever press (dashed bar) when aligned with the cue tone, indicating an inhibition during the lever-holding period. Right panel: A SNr neuron gradually increased its activity after the cue tone (gray bar) and reached a plateau with the lever release (see arrow head). Insets in each panel showed spike waveforms and inter-spike interval histograms of the example neuron.

