Fig. 6.
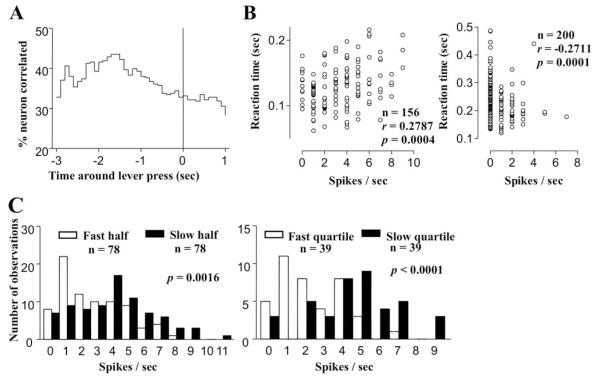
Correlation between reaction times and individual neural firing rates in the same trial. (A) Temporal function of the percentage of neurons showing significant correlation (i.e., p < 0.001 in 5 successive time points) between firing rates and reaction times pooled from the results of all six rats. More than 40% of neurons showed this correlation 1–2 s before lever press, at the middle of the nosepoke-lever press interval. (B) Examples of positive (left panel) and negative (right panel) correlations shown as scatter plots of RTs vs. the mean firing rates of two DMS neurons, 1.5–2.5 s before lever press, and −0.8 to 0.2 s around lever press, respectively. For the first neuron, these two variables showed a Spearman correlation coefficient of 0.2787 across the 156 correct trials (p = 0.0004). Reaction time became longer when this particular DMS neuron fired at higher rates in this time window. For the second neuron, a Spearman r of −0.2711 was found across the 200 trials with a p value of 0.0001. (C) Frequency distribution histograms of the firing rates in this time-window for the faster and the slower half of 78 trials (blank and filled histograms, respectively, left panel), and for the fastest and the slowest quartile of 39 trials (blank and filled histograms, respectively, right panel) for the sample neuron with positive correlation. Mann-Whitney nonparametric test showed moderately different distribution in the former (p = 0.0014) but more remarkable difference in the latter (p < 0.0001).

