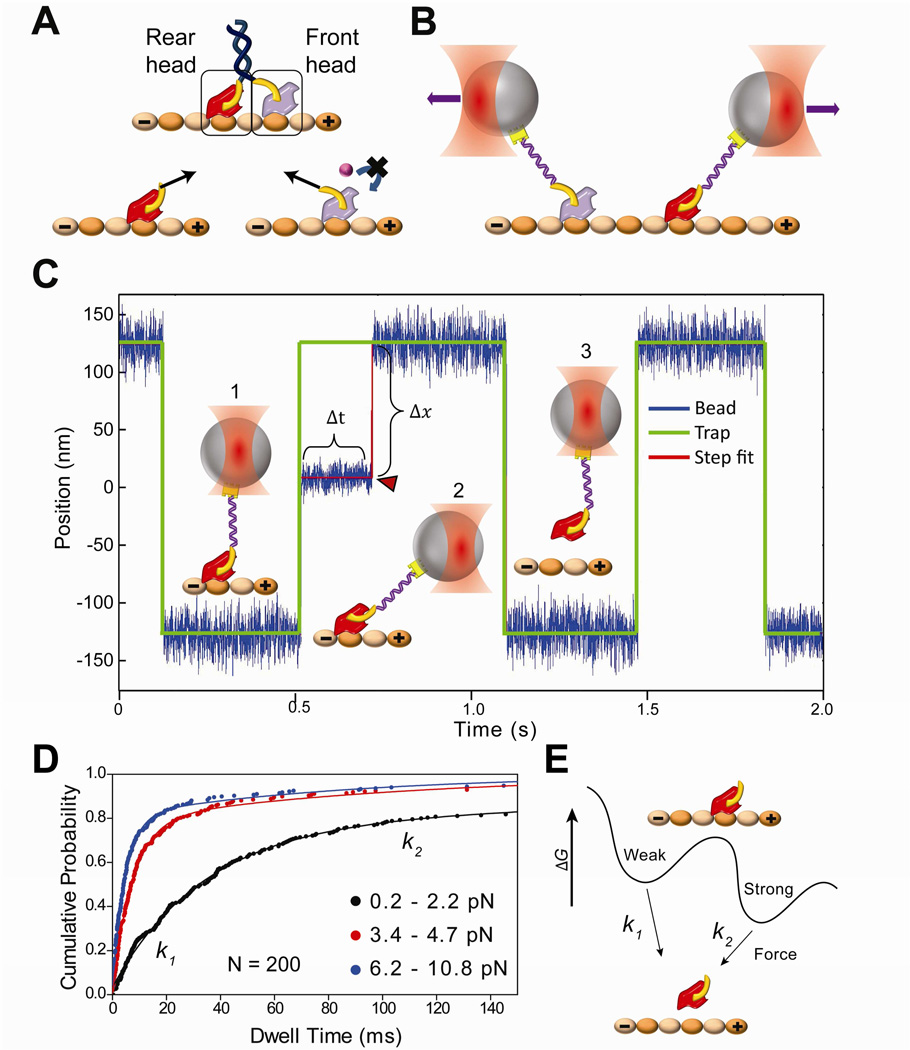
Figure 1. Force-dependent release of kinesin from MTs.
(A) (Top) Schematic of a kinesin dimer in a 2HB state. The NL (yellow) of the front head is oriented backwards and that of the rear head is oriented forward. (Bottom) Orientation of the NLs or tension between them (black arrows) may prevent ATP binding to the front head, or accelerate the nucleotide hydrolysis and subsequent MT release of the rear head to facilitate coordinated movement. (B) NL orientation of the front and rear heads can be mimicked by pulling a kinesin monomer from its NL via a short DNA tether using an optical trap (not to scale). (C) A trapped bead is oscillated between two positions 250 nm apart along the MT long axis. (1) When a monomer binds to the MT, (2) the movement of the bead to the next trap position is restricted. In this state, the trap exerts a constant force as a function of bead-trap separation (Δx) on the motor until it releases from the MT (Δt). (3) When the monomer releases from the MT (red arrowhead), the bead resumes following the trap. (D) Cumulative probability distributions (solid circles) represent the dwell time data for kinesin monomers pulled from the head towards the plus-end in the absence of nucleotide at different force ranges. N = 200 for each histogram. The release rates (k1 and k2) at a given force range were calculated by a two-exponential-decay fit (solid curves). (E) Model of kinesin-MT interaction shows two distinct binding modes in the apo state. k1 and k2 represent force-induced release rates from the weak and strong states, respectively.
See also Figures S1 and S2.

