
Fig. 2.
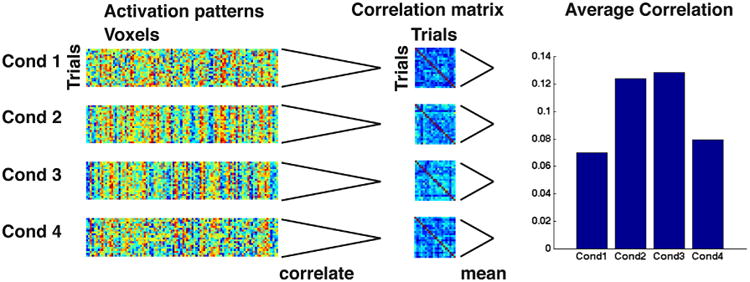
Visual representation of analysis method. This figure demonstrates the flow of each subject's data. (1) Parameter estimates of all trials are extracted within a collection of voxels and sorted according to condition. (2) Within each condition, all combinations of pairwise correlations are computed to give a trial × trial correlation matrix. (3) Within-block comparisons are removed from the matrix due to temporal autocorrelation. (4) The unique pairwise correlations (upper triangle, excluding within block correlations) are averaged together to generate an average correlation of each condition.