
Fig. 3.
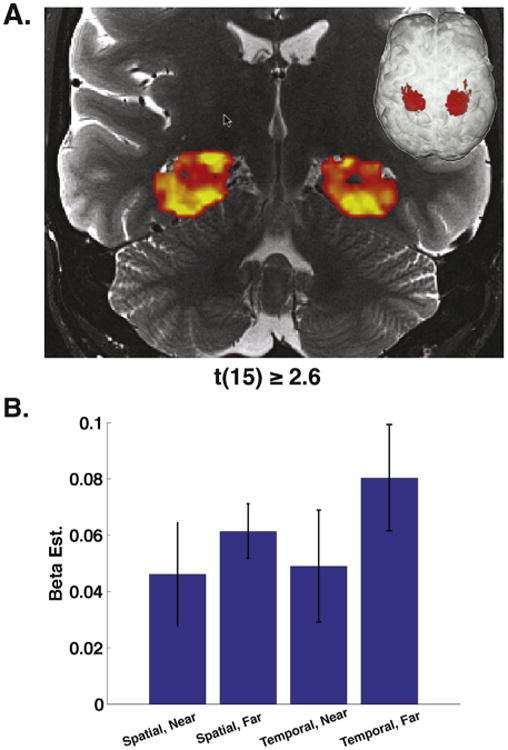
Univariate results. Group level contrast of task activation greater than baseline. (A) Coronal cross section of both left (1402 voxels) and right (1299 voxels) hemisphere clusters exhibiting task greater than baseline (t > 2.6, p < .01 corrected). (B) Average activations broken down by condition. Left and right hemisphere clusters were pooled, then voxel activations were averaged to find the average activation for each condition for each subject.