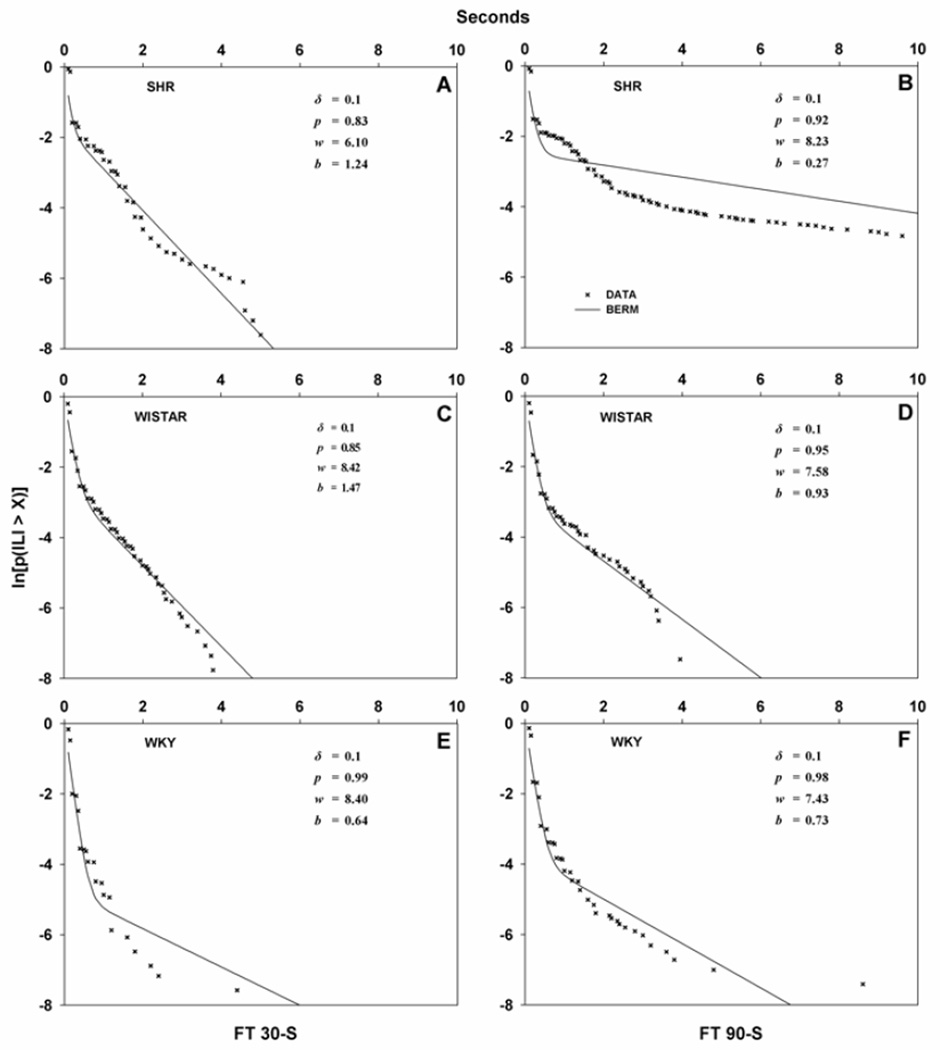
Figure 3.
Sample fits of BERM (Equation 1; continuous curves) to individual log-survival plots (the natural log of the probability of an ILI greater than X) from selected SHR (top panels), Wistar (middle panels), and WKY rats (bottom panels). For each strain × schedule (FT 30-s on the left, FT 90-s on the right) cell, the rat that produced the median lick/min was selected. Each panel includes BERM parameter estimates. BERM provided an adequate account of individual SIP performance.

