
Figure 3.
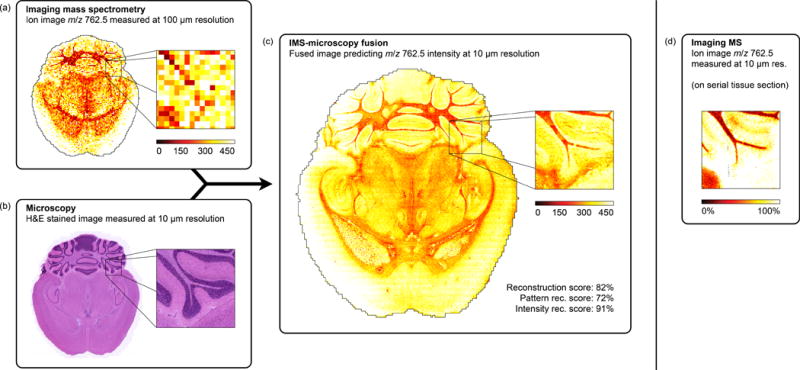
Prediction of the ion distribution of m/z 762.5 in mouse brain at 10 μm resolution from 100 μm IMS and 10 μm microscopy measurements (sharpening). This example in mouse brain fuses a measured ion image for m/z 762.5 (identified as lipid PE(16:0/22:6)) at 100 μm spatial resolution (a) with a measured H&E-stained microscopy image at 10 μm resolution (b), predicting the ion distribution of m/z 762.5 at 10 μm resolution (reconstr. score 82%) (c). For comparison, (d) shows a measured ion image for m/z 762.5 at 10 μm spatial resolution, acquired from a neighboring tissue section.