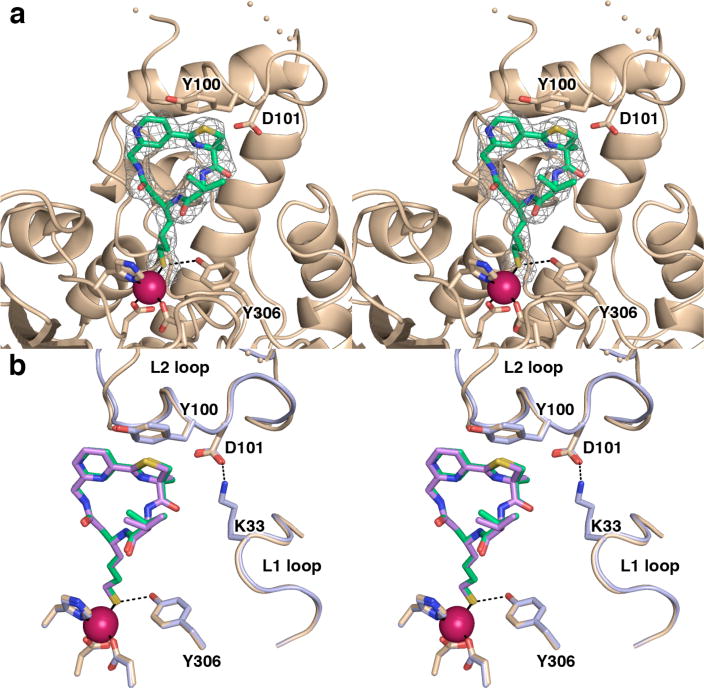
Figure 5.

(a) Simulated annealing omit map of 3 bound in the active site of HDAC8 (monomer B, contoured at 2.8σ). Atomic color codes are as follows: C = wheat (protein) or green (inhibitor), N = blue, O = red, and S = gold, Zn2+ = magenta sphere. Metal coordination and selected hydrogen bond interactions are shown as solid black or dashed black lines, respectively. Wheat-colored dotted lines indicate the disordered D87-D92 segment in the L2 loop. (b) Largazole analogues 3 and 2 bind similarly in the active site of HDAC8. While the L2 loops adopt slightly different conformations, Y100 and D101 are positioned similarly in each complex. The HDAC8–3 complex is color coded as in (a); for the HDAC8–2 complex (monomer A), C = light blue (protein) or violet (analogue 2).
