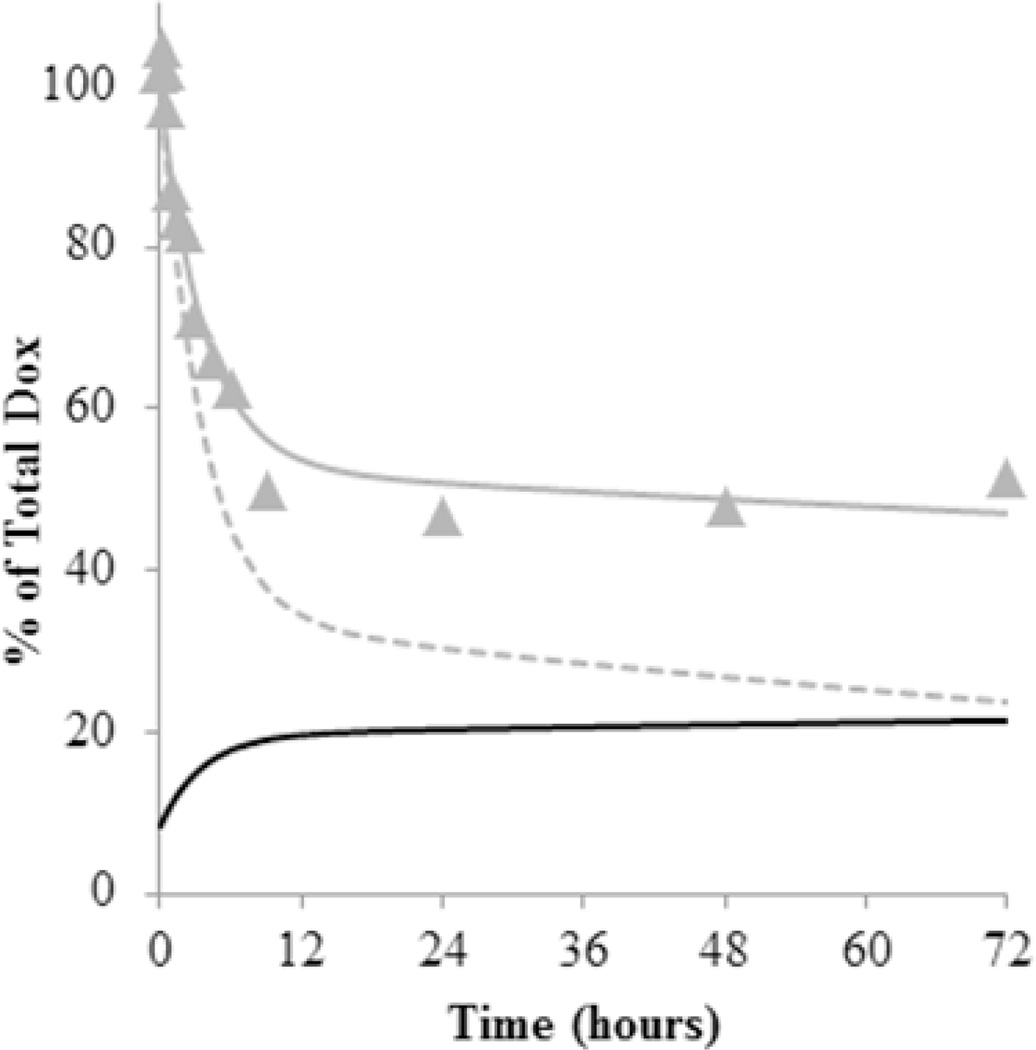
Figure 4.
Simulation of HYD-M (pH 5.0) release profile under non-sink conditions using rate constants in Table 1. The % Dox remaining after ultrafiltration ( ) versus time along with the fit using the mechanistic model (gray line) are compared to a simulation with no partitioning of unconjugated Dox ( =0) into the micelle (gray dotted line). Based on the values in Table 1, the amount of unconjugated Dox that partitioned into the micelle was also simulated as a % of total Dox present in the solution (black line).

