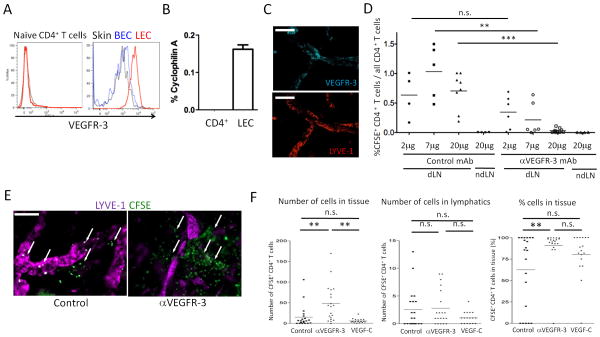
Figure 1. Anti-VEGFR-3 inhibits tissue to lymphatic to dLN migration of CD4+ T cells.
(A) VEGFR-3 expression of naïve CD4+ T cells, skin LEC, and skin BEC were analyzed by flow cytometry. Isotype control staining of LEC is shown in black thin solid lines. (B) VEGFR-3 mRNA expression of LEC and naïve CD4+ T cells analyzed by qRT-PCR. The values are shown as relative expression (%) of an endogenous control, cyclophilin A. Results from 2 mice/group, 2 independent experiments. (C) VEGFR-3 expression in afferent lymphatics in skin tissue in whole mount immunohistochemistry. Naive C57BL/6 ear skin sheets stained for LYVE-1 (Cy3) and VEGFR-3 (Cy5). Original magnification 200×. Bars, 100 μm. (D) CFSE-labeled CD4+ T cells plus 2, 7 or 20μg/mouse of control mAb (2A3) or anti-VEGFR-3 mAb (mF4-31C1) injected into foot pads. 12 hours later, popliteal LN (dLN) and axillary LN (ndLN) harvested, percentages of CFSE+ cells in LN CD4+ cells calculated, and compared by one-way ANOVA. Aggregated data are shown. Each point is a foot pad (n = 3-5/group) from 5 independent experiments. ** p < 0.005, *** p < 0.0005; n.s., not significant. (E) CFSE-labeled CD4+ T cells injected into C57BL/6 ear pinnae with 7μg control or anti-VEGFR-3 mAb, ears harvested at 6 hours, and skin sheets stained for LYVE-1 (Cy5). Representative images with transferred T cells (arrows). Original magnification 200×. Bars, 50 μm. (F) Same as (E), aggregate quantitative data for CFSE+ T cells in tissues and lymphatics at 12 hours. Each point is lymphatics observed in one field, 20 fields/ear from 2 mice/group for 4 independent experiments. ** p<0.005; n.s., not significant by one-way ANOVA.

