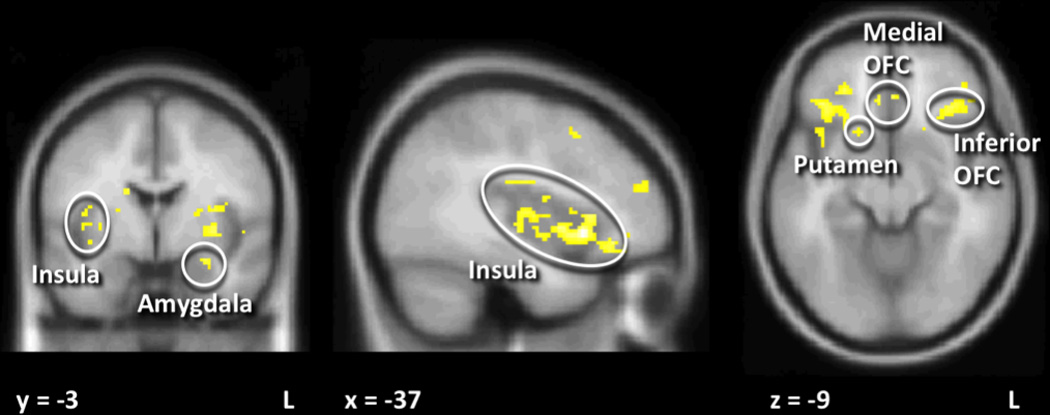
Figure 1. Neuronal response to sucrose expectation in obesity-resistant (OR) as compared to obesity-prone (OP) individuals.

SU expectation was associated with greater activation in amygdala, inferior OFC, medial OFC, insula and putamen in OR as compared to OP individuals after correction for multiple comparisons. Statistical maps thresholded at p < 0.001 and 10 voxel threshold for visualization and overlaid onto the group average anatomical image. Data are shown in the radiological convention (right hemisphere on the left).
