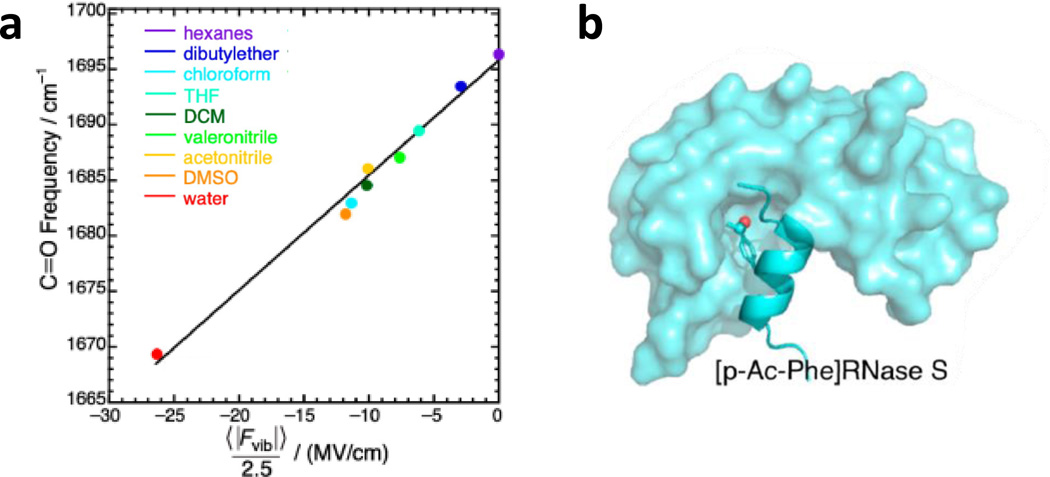
Figure 6.
(a) The frequency-field map for the C=O stretching vibration of acetophenone, determined via IR measurements in different solvents and MD simulations. (b) Cartoon representation of the binding of the S-peptide to the S-protein of Ribonuclease S, which brings the site-specific C=O probe (red) to an environment with a smaller electrostatic field. Figure adapted with permission from Fried et al. (125).

