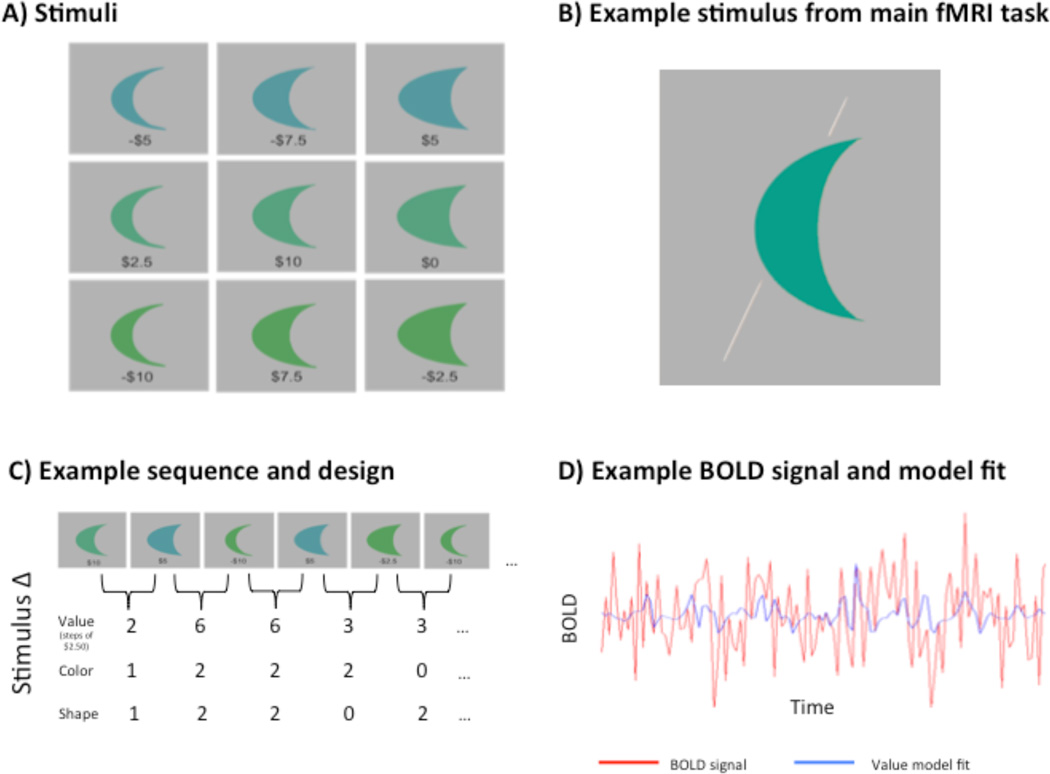
Figure 1.
(a) Subjects learned the values of these nine two-dimensional closed contours, or “moon” shapes, that varied across three orthogonal Dimensions: color, shape, and monetary value. The values indicated here are the expected values of a normally distributed set of possible values for each object. (b) During fMRI scanning, subjects judged whether the majority of the area of the shape was to the left or the right of the bisecting line (right, in this example). (c) Stimuli were presented in a counterbalanced and pseudorandom sequence. Covariates were made for each stimulus that captured the stepwise difference between each stimulus and the one preceding it. (d) Simulated BOLD response for a counterbalanced stimulus presentation (red), and the model fit (blue) for the value covariate.

