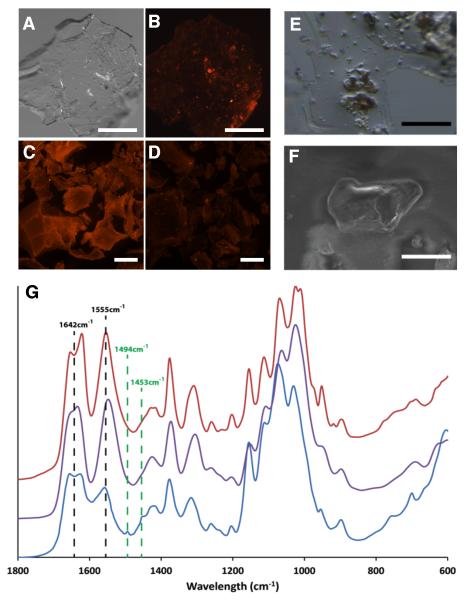
Figure 2.
Extraction and analysis of chitin from scale material of Atlantic salmon. (A-D) Skin (including scales) from a specimen of farmed Atlantic salmon was subjected to chitin extraction following procedures outlined in Methods (Supplemental Experimental Procedures). After extraction, the precipitated pellets were collected, stained for chitin with the CBD-546 probe and imaged using an epifluorescent stereomicroscope. Scale bars = 500 μm. (A) A representative pellet from the chitin extraction, photographed using visible light only. (B) CBD-546 chitin detection of the same pellet as in (A), showing strong punctate signals amongst a background of unstained or weakly stained material which has been shown to be comprised largely of deacetylated chitin. Controls included purified α-chitin from shrimp shells (C) and chitosan (75-85% deacetylated shrimp shell chitin) (D). The controls demonstrate that our CBD-546 probe is very specific to intact chitin as it did not give appreciable signals with chitosan. (E) Stereomicrograph of an area containing several chitinous granules within the thin, acid-soluble film. Scale bar = 100 μm. (F) SEM image of a chitinous granule. (G) FTIR analysis of the fingerprint region of the chitinous granules (blue) and its comparison with β-chitin from squid pen (purple) and α-chitin from shrimp shells (red). Two additional resonances -- 1494 cm−1 and 1453 cm−1 -- stand out as main differences of our extracted chitin with respect to the controls and are diagnostic of aromatic ring breathing modes that were subsequently identified as polystyrene contamination of the salmon material (discussed in Supplemental Information). Scale bar = 40 μm.

