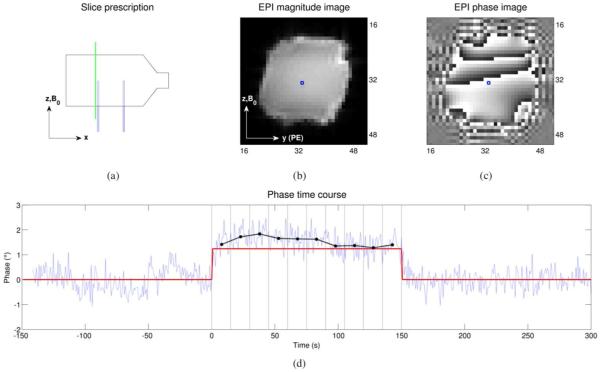
Fig. 2.
(a) The location of a slice in the y-z plane (a “sagittal” slice), slightly to the left of the left capillary tube in the volume-current phantom, is shown with the dashed green line. The corresponding EPI magnitude and phase DICOM images, as reconstructed by the scanner, are shown in (b) and (c), respectively (intensities are in arbitrary units, i.e., the 12-bit integer values typical of DICOM images). For the voxel marked with the blue square in (b) and (c), the phase time course (light blue) is shown in (d). The current is off for the first 150 seconds (the baseline period), on for the next 150 seconds (the ON period), and then off again for the last 150 seconds, as indicated by the red trace. The phase time course was quadratically detrended and the average value during the baseline period was subtracted out—in other words, the light blue trace shows the phase change (in degrees) relative to the baseline period, for this voxel. The ON period was divided into 15-second bins, indicated by the vertical black lines, and the average phase change (relative to baseline) for each bin was calculated and is shown by the black dots. This process was repeated for each voxel in order to generate the phase-change images shown in Fig. 3 and Fig. 4.

