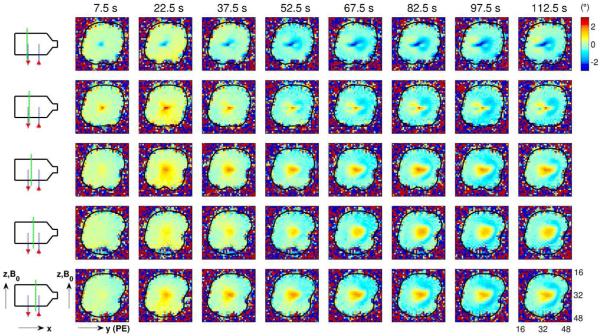
Fig. 4.
Phase-change images relative to baseline (in degrees) as in Fig. 3, but with the direction of the ionic currents reversed, i.e., current flows “up” the right capillary tube (in the positive z-direction), through the body of the phantom and “down” the left capillary tube (in the negative z-direction), as shown by the red arrows in the schematic diagrams. As with the results shown in Fig. 3, the spatial pattern of phase changes develops over the course of tens of seconds. However, unlike Fig. 3, the large region of phase change near the center of the phantom (e.g., see fourth row of images) is now positive (rather than negative), and migrates in the positive (rather than the negative) y-direction.

