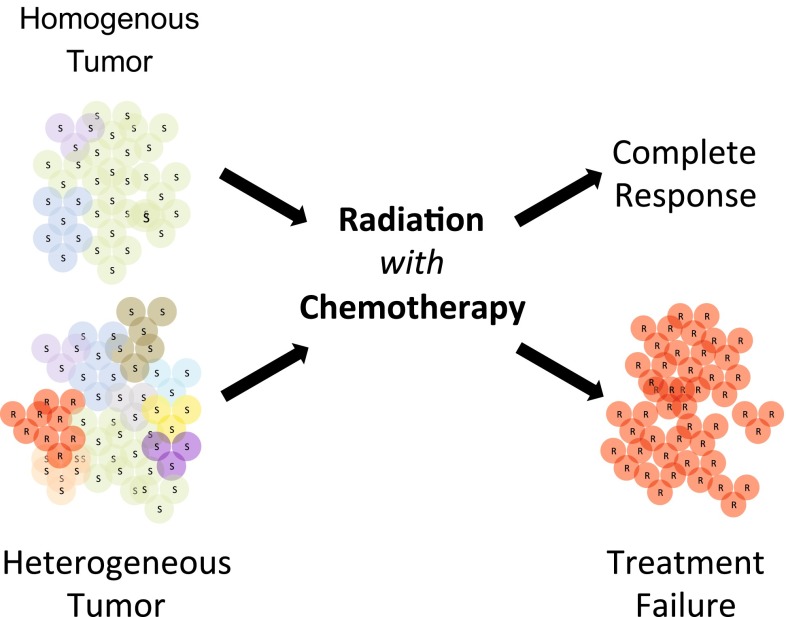
Fig. 1.
Intra-tumor heterogeneity as a source of treatment failure. Different tumor subpopulations are represented by colored circles that are either sensitive (S) or resistant (R) to therapy. The homogeneous tumor is depicted as containing few subpopulations, while the heterogeneous tumor is depicted as containing significantly more. Note that the red (R) subpopulation in the heterogeneous tumor is resistant to therapy and enriched after treatment failure. Implied in the figure is the central premise that a heterogeneous tumor with a larger number of subpopulations is more likely to possess a population resistant to therapy

