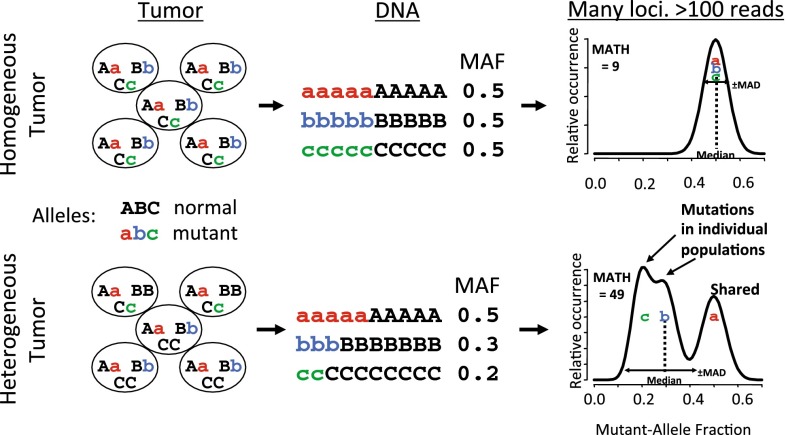
Fig. 2.
Schematic outline of Mutant Allele Tumor Heterogeneity. Homogenous (top) and heterogeneous (bottom) tumors containing normal (ABC) or mutant (abc) alleles, were subject to NGS and their mutant allele fraction (MAF) determined as part of MATH analysis before plotting their idealized MAF distributions (revised and modified schematic of data previously presented in [14])

