
Fig. 1.
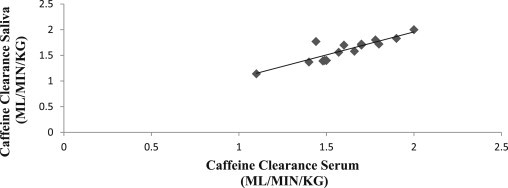
Scatter plot showing correlation between caffeine clearance in control serum and saliva: a positive slope with linear relation is evident; with scatter values distributed close to the graph.
Official websites use .gov
A
.gov website belongs to an official
government organization in the United States.
Secure .gov websites use HTTPS
A lock (
) or https:// means you've safely
connected to the .gov website. Share sensitive
information only on official, secure websites.
Scatter plot showing correlation between caffeine clearance in control serum and saliva: a positive slope with linear relation is evident; with scatter values distributed close to the graph.