
Fig. 3.
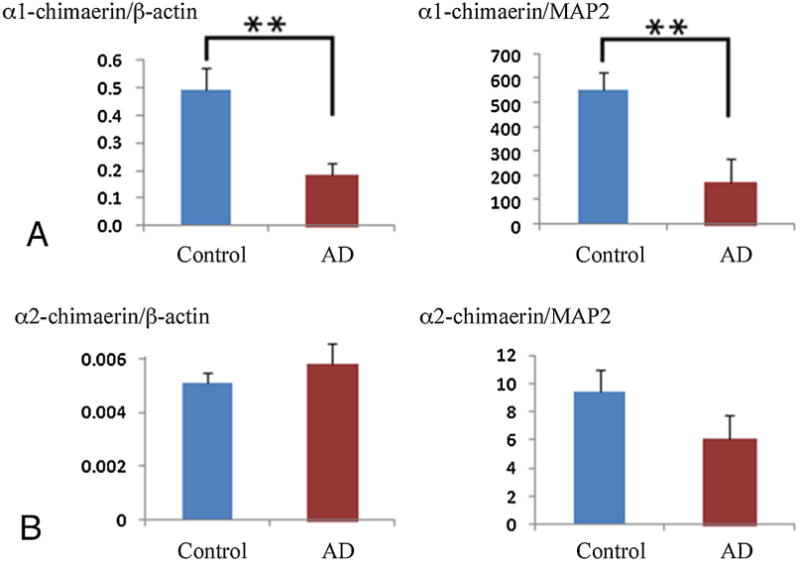
mRNA expression levels of α1-chimaerin (A) and α2-chimaerin (B) in the temporal cortex of patients with AD (n = 7) and control cases (n = 8) using real-time PCR. The mRNA expression levels of α1-chimaerin and α2-chimaerin are normalized to the ß-actin and MAP2 mRNA levels. The mRNA expression level of α1-chimaerin, but not α2-chimaerin, is significantly reduced in the temporal cortex of AD cases compared to controls. Results are presented as mean ± SEM. Statistical analysis was performed using Student's t-test: **P < 0.01 vs. control cases.