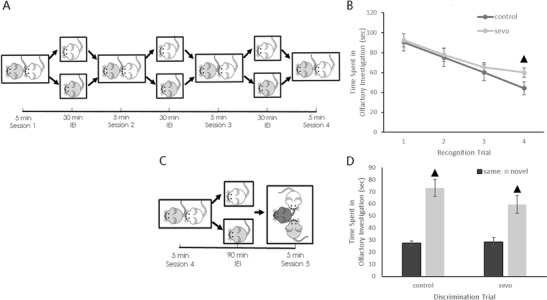
Fig. 1.

Illustration of the social recognition and social discrimination trials and raw results data. a Illustration of the social recognition paradigm. b Raw data of the olfactory investigation times in each session of the social recognition trial (▲ P < 0.001 compared between groups). c Illustration of the social discrimination paradigm. d Raw data of the olfactory investigation times in session 5 of the social discrimination trial (▲ P < 0.001 compared between the time spent investigating the same stimulus mouse and that of the novel stimulus mouse). All results are presented as the mean ± SD
