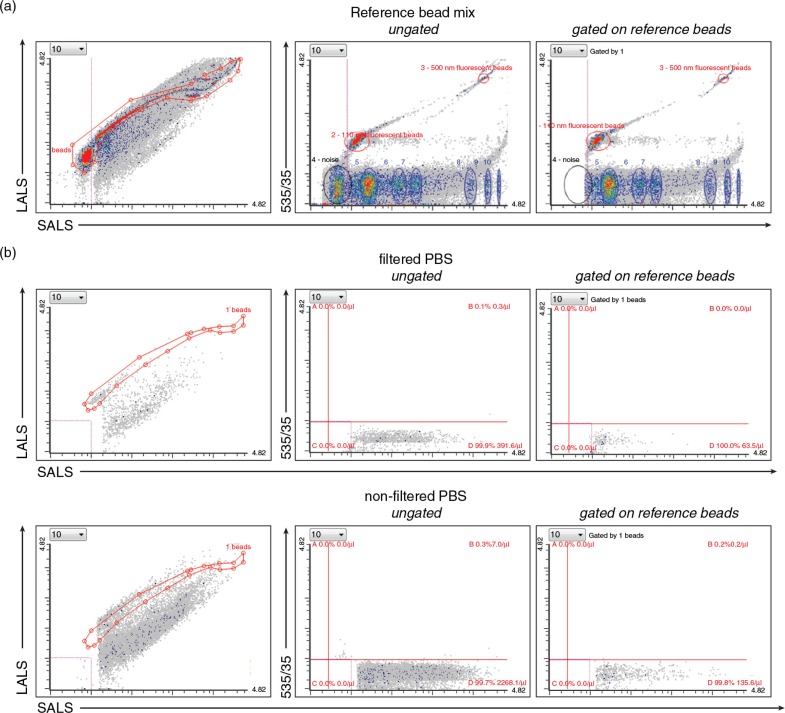
Fig. 1.
Setting up the dedicated flow cytometer (FC). (a) The resolution of the reference bead mix indicates the FC's performance in light scattering at default settings. Left cytogram shows small angle light scatter (SALS) versus large angle light scatter (LALS). Right cytogram depicts SALS versus 535/35 (green fluorescence triggering) channel. Six populations with refractive index (RI) 1.42 (blue ellipses) and two green fluorescent populations (110 nm and 500 nm) with RI 1.59 (red ellipses) were resolved from the instrument noise (black ellipse). The original outputs from Histogram software (Apogee Flow Systems) are shown. (b) Use of filtered (0.22 PVDF filter) PBS is highly recommended for all FC measurements. Left panels, diagrams show SALS versus LALS cytograms, middle panels show SALS versus 535/35 for ungated population, while right panels represent cytograms events gated on ROI 1 (beads) of reference bead mix in the SALS versus LALS cytograms. Gating on ROI 1 eliminates very rare false positive events in upper left quadrant B in case of PBS, but also results in significant decrease of fluorescently positive exs detected in this quadrant and thus is not used in following experiments. On contrary, employing the filtered PBS significantly decreased the total number of presumably noise events recorded in quadrant D, as well as non-specific events in quadrant B.

