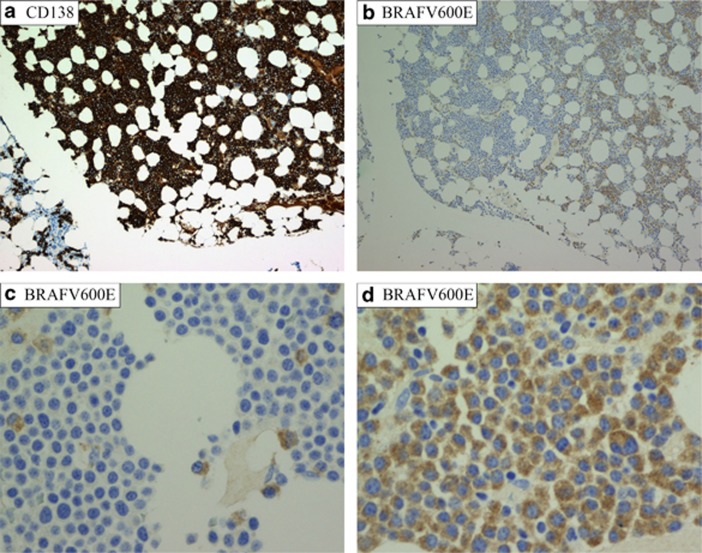
Figure 1.
IHC showing fraction and growth pattern of BRAF V600E mutated plasma cells. Microscopic images of bone marrow biopsy from patient 4 (Table 1). (a) The bone marrow was in large areas packed with CD138-positive myeloma cells. × 100 magnification. (b) The same area as in a with the BRAF V600E antibody. On the left side, almost none of the myeloma cells were positive, whereas the mutant clone predominated on the right side. × 100 magnification. (c and d) High-power field ( × 400) images from the area to the left (c) and right (d) side in image a and b. (c) Single scattered BRAF V600E-positive myeloma cells among predominating negative myeloma cells. In d, almost all myeloma cells were BRAF V600E positive.

