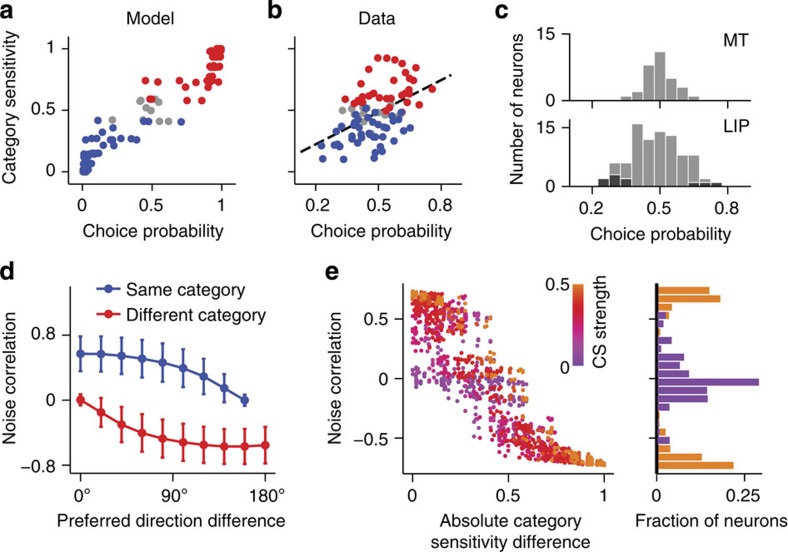
Figure 8. Model predicts interdependence between the CP, CS and noise correlations.
(a) In the association neurons, a positive correlation between the CP and CS arises through learning. In the scatter plot, each dot represents a CP–CS pair for an association neuron (measured after 500 trials), colour-coded according to its category preference (C1—red, C2—blue, nonselective—grey). (b) A significant positive correlation between the CP and CS was found in LIP neurons recorded from behaving monkeys, similar to the model prediction in a. (c) Histograms of CP in MT and LIP populations. Black shading indicates neurons with individually significant CP. Overall magnitude of CP was significantly greater in LIP than in MT. (d,e) Plasticity of the feedback connections from decision neurons gives rise to task-specific noise correlations. (d) After learning, noise correlations decrease with the difference in preferred directions of two neurons, but are stronger for neurons preferring the same category, than for neurons preferring different categories. Error bars indicate s.d. across neurons. (e) Noise correlations are stronger in pairs of association neurons with more similar and individually larger CS. Scatter plot of noise correlation (y axis) versus the absolute difference between the category sensitivities (x axis). Each dot is coloured according to the average CS strength in the pair (purple-to-orange colour code corresponds to low-to-high CS strength). Histograms show the distributions of noise correlations for neural pairs with the high (>0.4) and low (<0.1) average CS strength (orange and purple, respectively).

