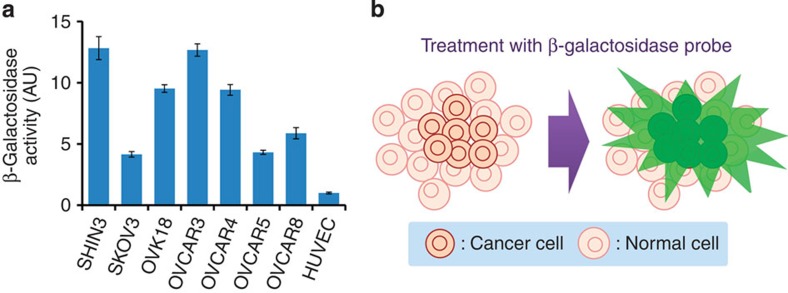
Figure 1. β-Galactosidase-targeting cancer visualization strategy.
(a) β-Galactosidase activity per protein abundance in lysate of SHIN3, SKOV3, OVK18, OVCAR3, OVCAR4, OVCAR5, OVCAR8 or HUVEC cells. Data represent mean±s.d. from a single experiment in triplicate. (b) Schematic illustration of fluorescence detection of cancer cells with enhanced β-galactosidase activity using a fluorescence probe.

