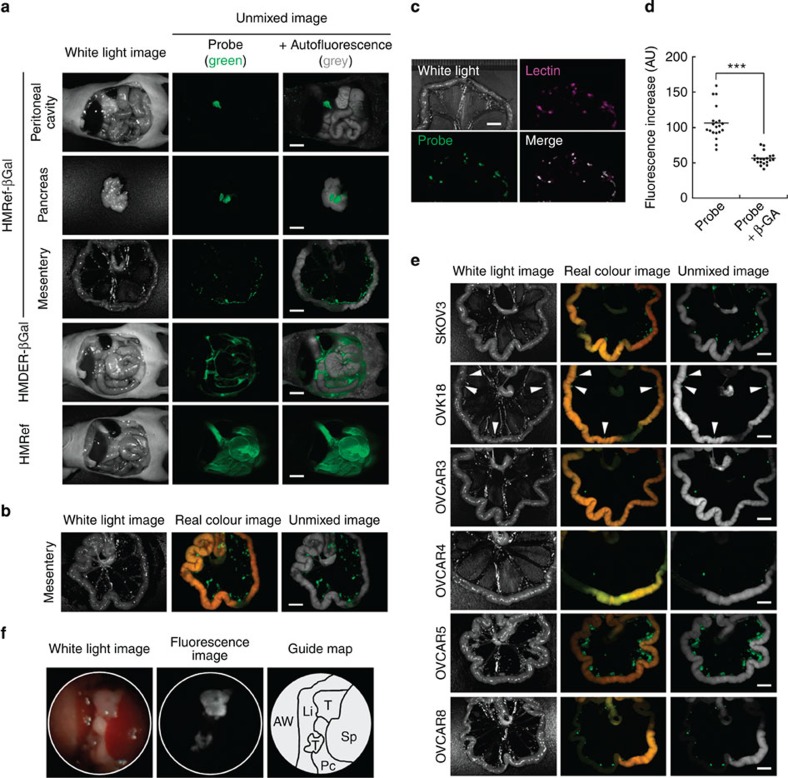
Figure 3. Visualization of peritoneal metastases in mouse models with HMRef-βGal.
(a,b) Fluorescence spectral imaging of peritoneal SHIN3 metastasis with various probes. At 5 min (a) or 1 h post administration of probe (b), mice were immediately killed and imaged. In spectral unmixed images, fluorescence from the probe and autofluorescence were assigned as green and grey, respectively. Scale bar, 5 mm. (c) Dual-colour fluorescence imaging of metastases. Lectin-targeted staining was performed as a marker for metastases (Lectin). The mouse model was also treated for 1 h with HMRef-βGal and imaged (Probe). The merged image was prepared by overlaying the two unmixed images. Scale bar, 5 mm. (d) Fluorescence intensity on tumour nodules. In live mouse models, tumour nodules were treated with 100 μM HMRef-βGal in the presence or absence of 10 mM β-GA (see Supplementary Fig. 6). ***P<0.001 by Welch’s t-test (n=20 for each group). (e) Fluorescence spectral imaging of several mouse models of peritoneal metastasis at 1 h post administration of HMRef-βGal. Arrowheads indicate metastases in the OVK18 images. Scale bar, 5 mm. (f) Fluorescence endoscopy of tumours inside the peritoneal cavity. AW, abdominal wall; Li, liver; Pc, pancreas; Sp, spleen; T, tumour. See Supplementary Video S1 online for real-time monitoring endoscopy.

