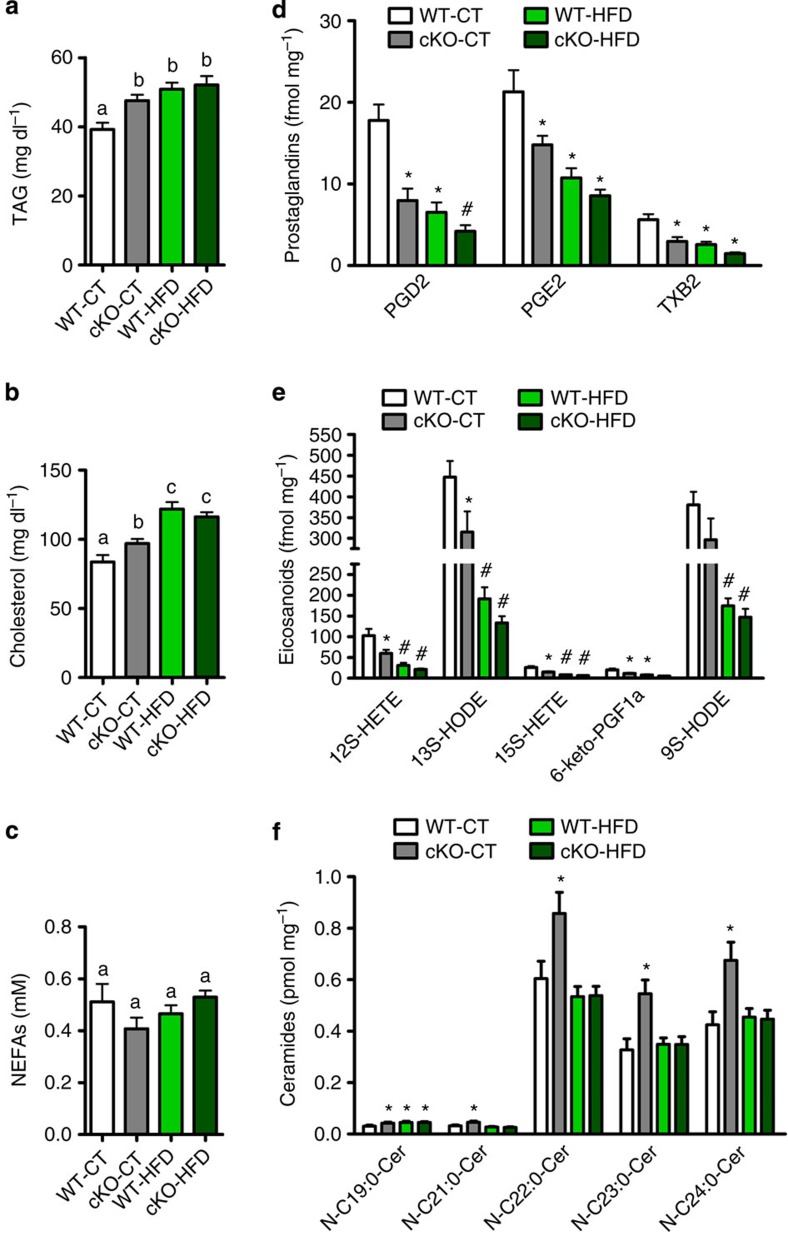
Figure 4. Adipose tissue Napepld deletion alters adipose and whole-body lipid metabolism.
(a) Plasma triglyceride content (mg dl−1; n=20–27). (b) Plasma cholesterol content (mg dl−1; n=20–27). (c) Plasma non-esterified fatty acid (NEFA) levels (mM; n=20–27). These data (a–c) correspond to the results of three independent experiments. (d) SAT prostaglandin content measured by LC-MS/MS in fmol per mg tissue (n=10). (e) SAT eicosanoid content measured by LC-MS/MS in fmol per mg tissue (n=10). (f) SAT ceramide content measured by ESI-MS/MS in pmol per mg tissue (n=10). See also Supplementary Table 1. Data are presented as mean±s.e.m. Data with different superscript letters or symbols are significantly different (P<0.05) according to post-hoc one-way analysis of variance. ‘*’ indicates a significant difference (P<0.05) versus WT-CT, and ‘#’ indicates a significant difference (P<0.05) versus WT-CT and cKO-CT according to post-hoc one-way analysis of variance.

