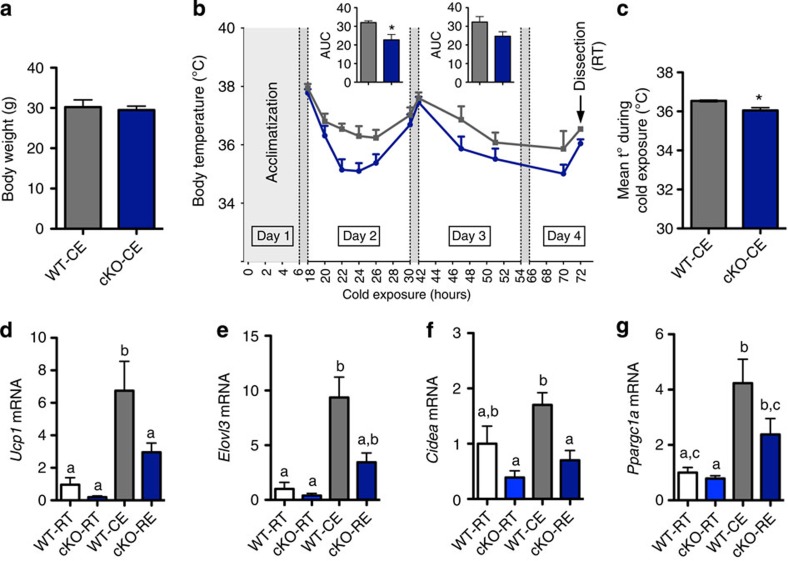
Figure 6. Adipose tissue Napepld deletion induces an altered response to cold exposure.
(a) Total body weight (g; n=7). (b) Body temperature evolution (°C) during 72-h cold exposure (n=7). Inserts represent the area under the curve (AUC) of day 2 and 3, with baseline set at 34 °C. (c) Mean body temperature (t°) measured in °C during cold exposure (n=7). (d) Ucp1 mRNA levels, (e) Elovl3 mRNA levels, (f) Cidea mRNA levels and (g) Ppargc1a mRNA levels (relative expression) in SAT of room temperature (RT) and cold-exposed (CE) WT and cKO mice (n=7). Data are presented as mean±s.e.m. Two-way repeated-measure analysis of variance (ANOVA; genotype × time) revealed a significant effect of genotype (P=0.02), a significant effect of time (P<0.0001), and a non-significant interaction between factors (P=0.4). Post-hoc pairwise comparisons with Bonferroni correction did not show significant differences at any of the time points in b. Data with ‘*’ are significantly different (P<0.05) according to the unpaired two-tailed Student t-test. Data with different superscript letters are significantly different (P<0.05) according to post-hoc one-way analysis of variance.

