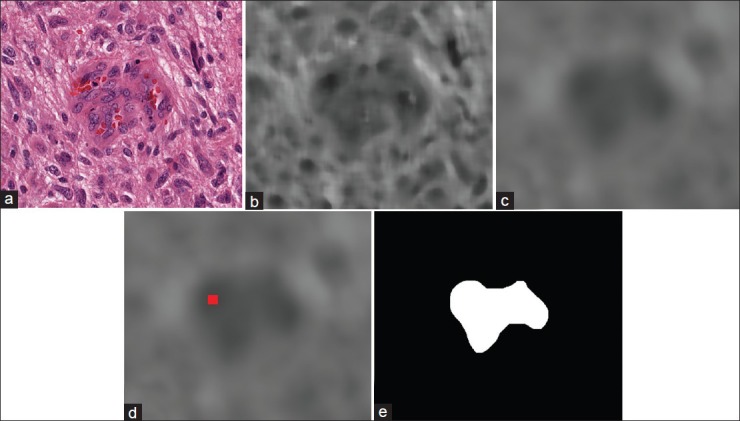
Figure 5.

An example of flow of procedures for MVP detection algorithm on a small ROI. (a) sample ROI (b) The output image after applying median filter (c) filtered image by mean filter (d) detected valley in the image showed as a red dot (e) segmented potential MVP region
