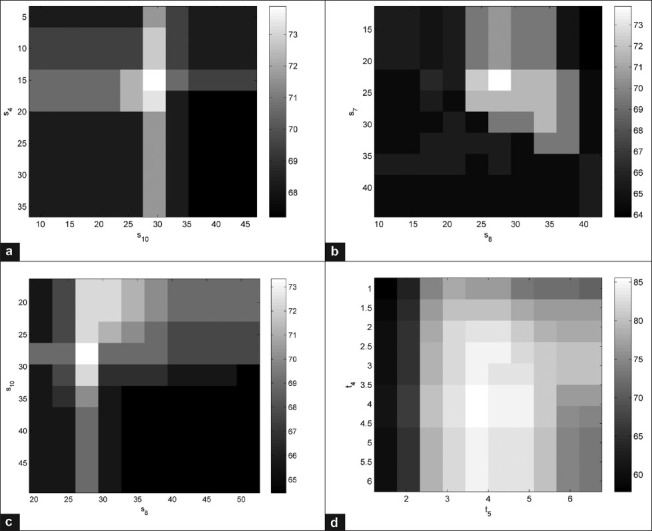
Figure 9.

Sensitivity of overall accuracy of the microvascular proliferation detection (a-c) necrosis detection (d) to the choice of parameters in the model. We deliberately chose the most influential parameters in the decision trees (s4, s8, s10, t4, t5) and evaluated the performance (overall classification accuracy) of each algorithm with respect to the change of these parameters. The white squares correspond to the higher overall accuracies while darker squares mean lower performance. The gray bar is showing the accuracies in percentage
