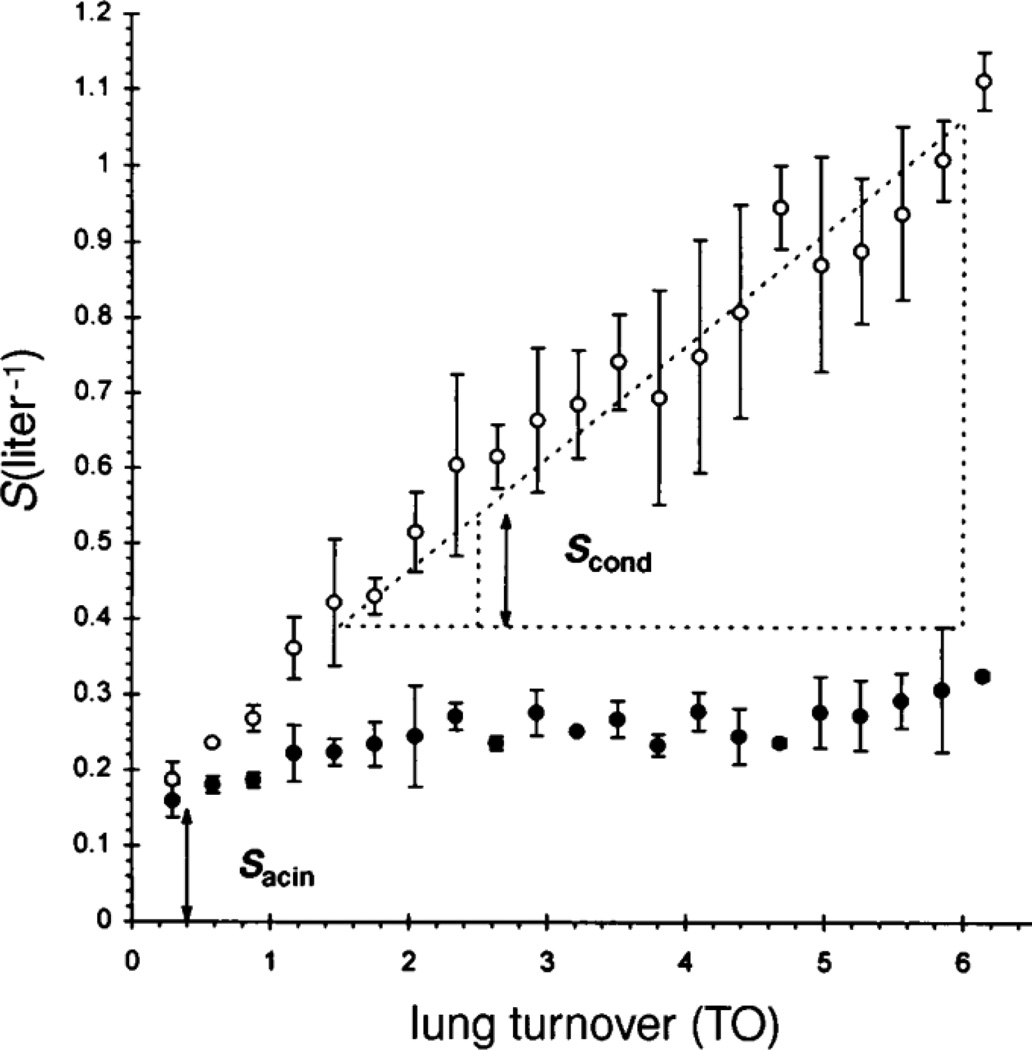
Figure 8.
Normalized slopes of phase III in a multibreath N2 washout study of a hyperresponsive subject, plotted as a function of lung turnover (proportional to breath number). Baseline slopes (solid symbols) vary but little over the maneuver, while there is a significant increase in slope following histamine provocation (open symbols). These are interpreted as reflecting diffusion (Sacin) and convection (Scond) dominated inhomogeneities, respectively. From Verbanck et al., 1997.

