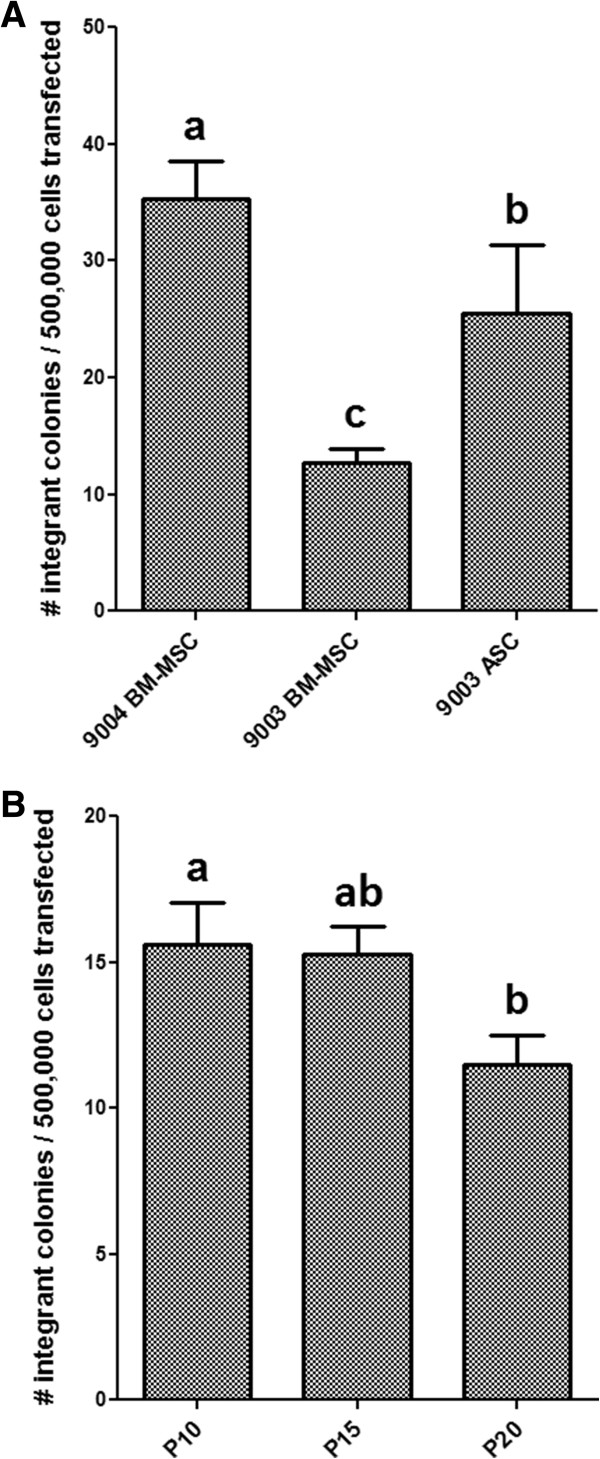
Figure 10.

Transfection and integration efficiency in MSCs. P5 MSCs (A) and 9004 BM-MSC at passages 10, 15 and 20 (B) were transfected with pEGFP-N1. Integrant number were expressed as the number of discrete colonies that were resistant to G418 selection. Statistically significant groups by Tukey’s test is indicated by letters (P < 0.05). 9004 BM-MSC showed the highest number of integrants, followed by 9003 ASC and 9003 BM-MSC. 9004 BM-MSC showed a decreasing trend in number of integrants with increasing passages.
