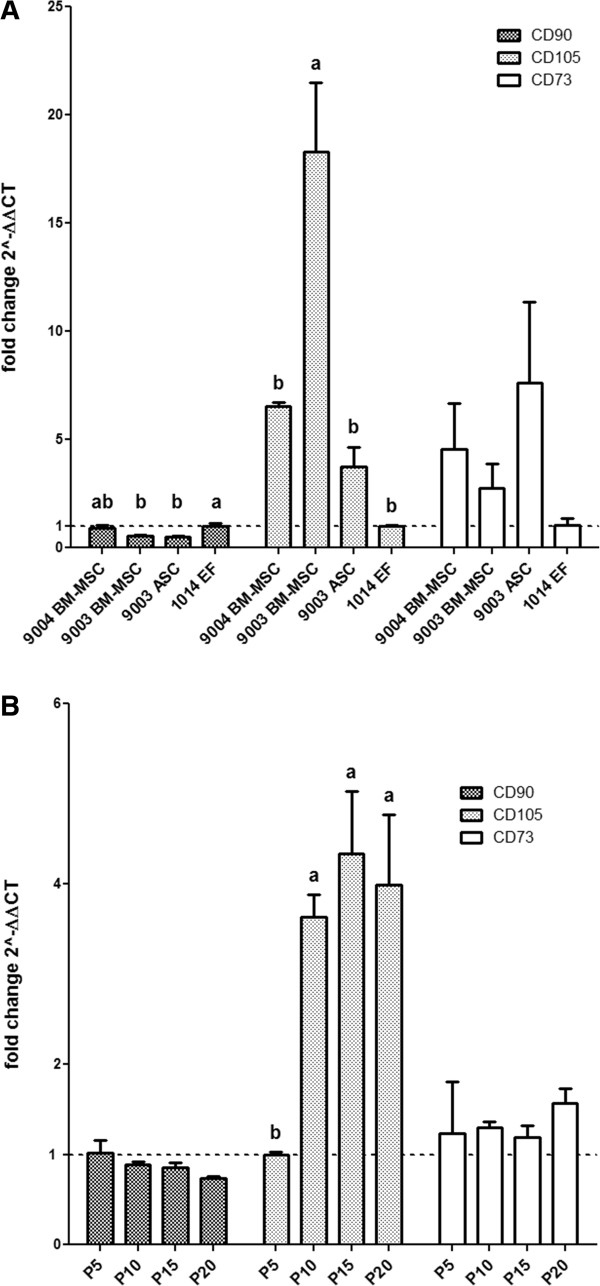
Figure 8.

Cell surface marker expression in MSCs and fibroblasts. Quantitative RT-PCR was used to measure the expression of the cell surface markers CD90, CD105 and CD73 in P5 MSCs (A) and in 9004 BM-MSCs at passages 10, 15 and 20 (B). Expression levels are presented as fold change (± SEM) relative to 1014 EF (A) or expression levels in P5 9004 BM-MSC (B) (fold change ~1, indicated by the dotted line). Statistically significant groups by Tukey’s multiple means comparison test are indicated by letters (P < 0.05). Significant differences between the cell lines were observed in CD90 and CD105 expression. Significant difference between the different passages was observed in CD105, but not in CD90 and CD73.
